Sampling Distribution Practice Questions with Answers
Concept Explanation
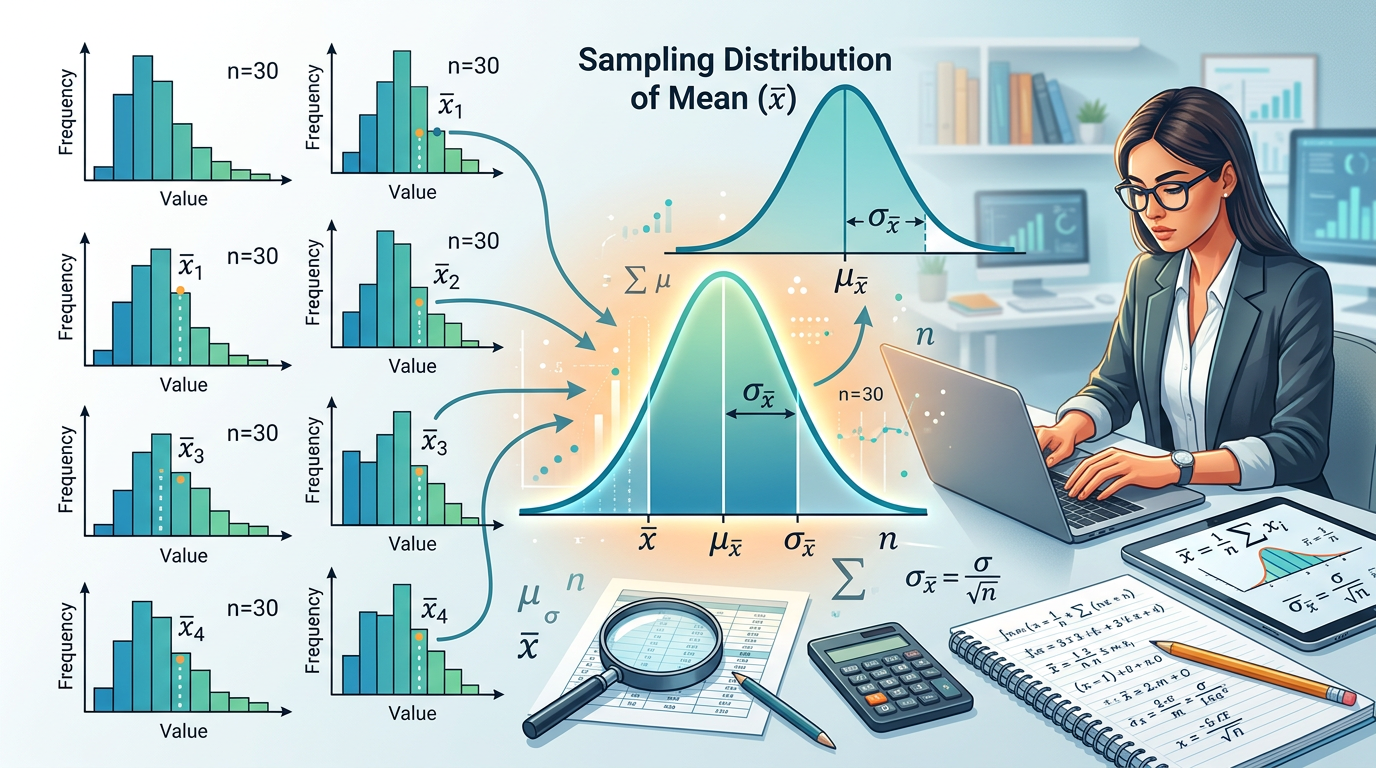
A sampling distribution is the probability distribution of a specific statistic (such as the mean, proportion, or variance) calculated from all possible random samples of a specific size $n$ drawn from a given population. While a population distribution describes the individuals within a group, a sampling distribution describes how a statistic behaves across repeated sampling. This concept is fundamental to inferential statistics, as it allows researchers to make predictions about a population based on a single sample. According to the Central Limit Theorem, if the sample size is sufficiently large (usually ), the sampling distribution of the mean will be approximately normal, regardless of the population's underlying distribution shape. This mathematical bridge enables the use of Z-scores and P-values in hypothesis testing. Just as understanding molecular structures is vital in VSEPR geometry, understanding the spread and center of these distributions is vital for data science.
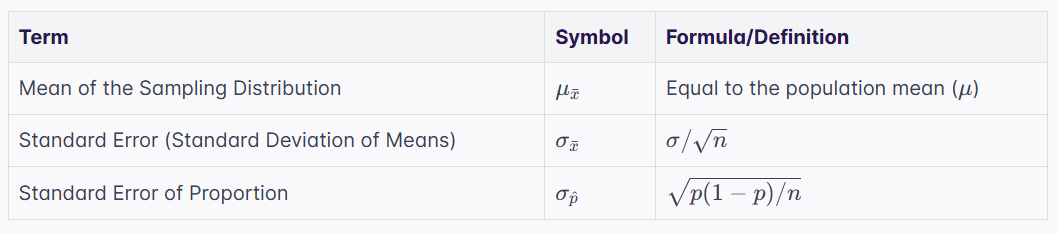
Key Parameters of Sampling Distributions
Solved Examples
-
Calculating Standard Error: A population has a mean of 100 and a standard deviation of 20. If you take a random sample of 25 individuals, what is the mean and standard error of the sampling distribution?
-
Identify the population parameters: , , and .
-
The mean of the sampling distribution is equal to the population mean: .
-
Apply the standard error formula: .
-
The sampling distribution is centered at 100 with a standard error of 4.
-
-
Finding Probabilities using Z-scores: The average weight of a specific fruit is 150g with a standard deviation of 12g. What is the probability that a random sample of 36 fruits has a mean weight greater than 153g?
-
Calculate the standard error: .
-
Calculate the Z-score: .
-
Look up in a standard normal table. The area to the left is 0.9332.
-
Find the area to the right: $1 - 0.9332 = 0.0668$. The probability is 6.68%.
-
-
Sampling Distribution of Proportions: It is known that 40% of voters support a specific policy. In a sample of 100 voters, what is the standard deviation of the sampling distribution of the proportion?
-
Identify and .
-
Use the formula for standard error of proportion: .
-
Calculate the numerator: $0.40 \times 0.60 = 0.24$.
-
Divide and take the square root: .
-
Practice Questions
-
A population is normally distributed with and . If a sample of is selected, what is the standard error of the mean?
-
According to the Khan Academy Statistics Library, the Central Limit Theorem applies when $n$ is large. If a population is highly skewed, why does the sampling distribution of the mean become normal as $n$ increases?
-
A manufacturer claims lightbulbs last 1200 hours with . A quality control team tests 100 bulbs. What is the probability the sample mean is less than 1170 hours?
Want unlimited practice questions like these?
Generate AI-powered questions with step-by-step solutions on any topic.
Try Question Generator Free →-
Suppose 20% of all students at a university are left-handed. If you take a sample of 200 students, what is the mean and standard deviation of the sampling distribution of the sample proportion ?
-
How does quadrupling the sample size $n$ affect the standard error of the mean?
-
A population has a mean of 80 and a standard deviation of 16. What is the Z-score for a sample mean of 75 from a sample of size ?
-
In a large city, 15% of people use public transit. In a random sample of 400 people, find the probability that more than 18% use public transit.
-
Explain the difference between the standard deviation of a population and the standard error of the mean.
-
A researcher takes a sample of size from a population where and . If the population is NOT normal, can we assume the sampling distribution of the mean is normal?
-
The heights of adult men are normally distributed with inches and inches. If a group of 9 men is chosen, what is the probability their average height is between 69 and 71 inches?
Answers & Explanations
-
Standard Error: . Even with a small sample size, the standard error is half the population standard deviation.
-
Central Limit Theorem: As $n$ increases, the means of the samples tend to cluster around the population mean. Extreme values in the population are increasingly likely to be balanced out by other values in the sample, resulting in a bell-shaped distribution of means.
-
Lightbulb Probability: . . The area for is 0.0228. There is a 2.28% chance.
-
Proportion Mean and SD: . .
-
Effect of $n$ on Standard Error: Because the formula involves in the denominator, quadrupling $n$ (making it $4n$) results in a denominator of . This cuts the standard error in half.
-
Z-score Calculation: . .
-
Transit Proportion: . . . The probability of $Z > 1.68$ is $1 - 0.9535 = 0.0465$ (4.65%).
-
SD vs Standard Error: Standard deviation measures the variability of individual data points in a population. Standard error measures the variability of a statistic (like the mean) across different samples. Standard error is always smaller than population SD for $n > 1$.
-
Normality Assumption: No. Generally, is the rule of thumb for the Central Limit Theorem to apply to non-normal populations. Since , we cannot confidently assume normality unless the population itself was normal.
-
Height Range: . We want P(69 < \bar{x} < 71). $Z$ for 69 is . $Z$ for 71 is . The area between and is $0.8413 - 0.1587 = 0.6826$ (68.26%).
Quick Quiz
1. If the sample size $n$ increases, what happens to the standard error of the mean?
- A It increases
- B It decreases
- C It stays the same
- D It becomes equal to the population mean
Check answer
Answer: B. It decreases
2. The mean of the sampling distribution of the mean () is always equal to:
- A The sample standard deviation
- B The population mean
- C The sample size divided by two
- D The population variance
Check answer
Answer: B. The population mean
3. Which theorem states that the sampling distribution of the mean approaches normality as $n$ increases?
- A The Law of Large Numbers
- B The Central Limit Theorem
- C Bayes' Theorem
- D The Pythagorean Theorem
Check answer
Answer: B. The Central Limit Theorem
4. For a population with and , what is the standard error?
- A 4
- B 25
- C 20
- D 10
Check answer
Answer: C. 20
5. A sampling distribution of the proportion is approximately normal if:
- A $n$ is at least 5
- B and
- C The population size is small
- D The standard deviation is zero
Check answer
Answer: B. and
Want unlimited practice questions like these?
Generate AI-powered questions with step-by-step solutions on any topic.
Try Question Generator Free →Frequently Asked Questions
What is a sampling distribution?
A sampling distribution is a theoretical distribution of all possible values of a sample statistic, such as the mean or proportion, that could be obtained from all possible samples of a specific size drawn from a population.
Why is the Central Limit Theorem important?
The Central Limit Theorem is vital because it allows statisticians to use normal distribution techniques to make inferences about population means even when the population distribution is unknown or non-normal, provided the sample size is large enough.
How does sample size affect the sampling distribution?
As the sample size increases, the sampling distribution becomes more tightly clustered around the population mean, resulting in a smaller standard error and a more normal shape. This makes the sample mean a more reliable estimator of the population mean.
What is the difference between a parameter and a statistic?
A parameter is a numerical value that describes a characteristic of an entire population (like ), whereas a statistic is a numerical value calculated from a sample (like ) used to estimate the parameter. Just as polarity determination requires looking at molecular characteristics, statistics requires looking at sample characteristics.
When should I use the standard error of the proportion?
You should use the standard error of the proportion when you are dealing with categorical data where you are measuring the percentage or fraction of a sample that meets a certain criterion, such as "yes/no" surveys or success rates. This is similar to classifying molecules in functional group identification.
Want unlimited practice questions like these?
Generate AI-powered questions with step-by-step solutions on any topic.
Try Question Generator Free →
Want unlimited practice questions like these?
Generate AI-powered questions with step-by-step solutions on any topic.
Try Question Generator Free →Enjoyed this article?
Share it with others who might find it helpful.