Mean, Median, Mode Practice Questions with Answers

Concept Explanation
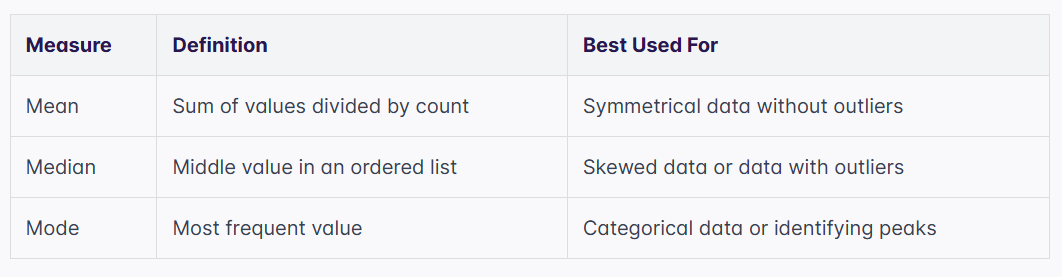
The mean, median, and mode are the three primary measures of central tendency used in statistics to describe the center or typical value of a data set. These metrics provide a summary of a distribution, allowing researchers and students to understand the general trend of a group of numbers. While they all measure the "center," they do so in fundamentally different ways, making each one useful for different types of data analysis.
The Mean (Arithmetic Average)
The mean is calculated by summing all the values in a data set and dividing that sum by the total number of values. It is the most common measure of central tendency. However, the mean is highly sensitive to outliers—values that are significantly higher or lower than the rest of the data. For instance, in a set of salaries where one person earns millions while others earn thousands, the mean will be skewed upward, potentially misrepresenting the "average" person's income. You can learn more about how data distributions affect calculations in our guide on Easy Polarity Determination Practice Questions, which explores similar analytical logic in chemistry.
The Median (Middle Value)
The median is the middle value of a data set when the numbers are arranged in ascending or descending order. If the data set has an odd number of observations, the median is the exact middle number. If the data set has an even number of observations, the median is the average of the two middle numbers. The median is a "robust" measure because it is not affected by extreme outliers, making it the preferred metric for reporting median household income or home prices. Organizations like the U.S. Census Bureau frequently use the median to provide a more accurate picture of economic data.
The Mode (Most Frequent Value)
The mode is the value that appears most frequently in a data set. A data set can have one mode (unimodal), two modes (bimodal), or multiple modes (multimodal). If no number repeats, the data set has no mode. The mode is particularly useful for categorical data, such as determining the most popular car color in a parking lot. Understanding frequency is also a key skill when interpreting spectral data, as seen in Medium NMR Interpretation Practice Questions.
Solved Examples
Review these step-by-step solutions to master the application of mean, median, and mode across different data structures.
Example 1: Basic Discrete Set
Find the mean, median, and mode for the set: {3, 8, 10, 15, 3, 7}.
-
Mean: Add the numbers: 3 + 8 + 10 + 15 + 3 + 7 = 46. Divide by the count (6): 46 / 6 ≈ 7.67.
-
Median: Order the set: {3, 3, 7, 8, 10, 15}. Since there are 6 numbers, average the 3rd and 4th: (7 + 8) / 2 = 7.5.
-
Mode: The number 3 appears twice, while others appear once. Mode = 3.
Example 2: Managing Outliers
A small business has five employees with salaries: $30k, $32k, $35k, $38k, and $120k. Calculate the mean and median.
-
Mean: (30 + 32 + 35 + 38 + 120) / 5 = 255 / 5 = $51k.
-
Median: The values are already ordered. The middle (3rd) value is $35k.
-
Analysis: Note how the outlier ($120k) pulled the mean far above what most employees earn, while the median remains representative.
Example 3: Bimodal Data
Identify the mode(s) for the following test scores: 72, 85, 72, 90, 85, 100, 92.
-
Count frequencies: 72 (twice), 85 (twice), 90 (once), 92 (once), 100 (once).
-
Since both 72 and 85 appear with the highest frequency, the set is bimodal.
-
Modes = 72 and 85.
Practice Questions
Test your understanding with these mean, median, mode practice questions. For more advanced analytical practice, check out our Hard Hybridization Practice Questions.
1. Find the mean of the following data set: 12, 15, 18, 22, 30.
2. Determine the median for this set of numbers: 4, 1, 7, 9, 3, 11.
3. Identify the mode(s) for this list: 5, 8, 5, 12, 8, 15, 8, 20.
Want unlimited practice questions like these?
Generate AI-powered questions with step-by-step solutions on any topic.
Try Question Generator Free →4. A student scored 80, 85, and 90 on three exams. What score do they need on the fourth exam to have a mean of 88?
5. In a data set with 10 values, the mean is 25. If one value of 43 is added, what is the new mean?
6. Find the median of the following set: 55, 62, 48, 70, 55, 81, 65, 59.
7. True or False: If you add 10 to every number in a data set, the mean increases by 10, but the median stays the same.
8. A dataset consists of: 2, 2, 3, 3, 4, 4. What is the mode?
9. Calculate the mean, median, and mode for: 10, 20, 30, 40, 50.
10. If the median of five consecutive integers is 12, what is the mean of those integers?
Answers & Explanations
1. Answer: 19.4. Add the numbers: 12 + 15 + 18 + 22 + 30 = 97. Divide by 5: 97 / 5 = 19.4.
2. Answer: 5.5. First, order the numbers: 1, 3, 4, 7, 9, 11. Since there are 6 numbers (even), average the 3rd and 4th: (4 + 7) / 2 = 5.5.
3. Answer: 8. The number 8 appears three times, while 5 appears twice and others appear once. 8 is the most frequent.
4. Answer: 97. To have a mean of 88 over 4 exams, the total sum must be 88 * 4 = 352. Current sum: 80 + 85 + 90 = 255. Required score: 352 - 255 = 97.
5. Answer: 26.64. Original sum = 10 * 25 = 250. New sum = 250 + 43 = 293. New count = 11. New mean = 293 / 11 ≈ 26.64.
6. Answer: 60.5. Order the set: 48, 55, 55, 59, 62, 65, 70, 81. Average the 4th and 5th values: (59 + 62) / 2 = 60.5.
7. Answer: False. Both the mean and the median will increase by 10 because the entire distribution shifts upward on the number line.
8. Answer: 2, 3, and 4 (Multimodal). Each of these values appears twice. Since they all share the highest frequency, they are all modes.
9. Answer: Mean = 30, Median = 30, Mode = None. Sum (150) / 5 = 30. Middle value is 30. No number repeats, so there is no mode.
10. Answer: 12. In any set of consecutive integers (or any symmetrical distribution), the mean and median are equal. If the median is 12, the set is 10, 11, 12, 13, 14. The mean is also 12.
Quick Quiz
1. Which measure of central tendency is most affected by extreme outliers?
- A Median
- B Mean
- C Mode
- D Range
Check answer
Answer: B. Mean
2. If a data set is perfectly symmetrical, such as a normal distribution, what is the relationship between the mean and median?
- A The mean is larger than the median
- B The median is larger than the mean
- C The mean and median are equal
- D The mean and median cannot be determined
Check answer
Answer: C. The mean and median are equal
3. A data set contains the values: 10, 10, 20, 30, 40. What is the mode?
- A 10
- B 22
- C 20
- D No mode
Check answer
Answer: A. 10
4. You have a list of categorical data representing the favorite colors of students. Which metric should you use to find the most popular color?
- A Mean
- B Median
- C Mode
- D Standard Deviation
Check answer
Answer: C. Mode
5. What is the median of the set {15, 5, 20, 10}?
- A 10
- B 12.5
- C 15
- D 11.25
Check answer
Answer: B. 12.5
Want unlimited practice questions like these?
Generate AI-powered questions with step-by-step solutions on any topic.
Try Question Generator Free →Frequently Asked Questions
Can a data set have more than one mode?
Yes, a data set can be bimodal (two modes) or multimodal (more than two modes) if multiple values share the highest frequency. If every value appears only once, the set is typically described as having no mode.
When is the median better than the mean?
The median is better when the data set contains significant outliers or is highly skewed, such as in real estate prices or annual incomes. It provides a more accurate representation of the "middle" of the data without being distorted by extreme values.
How do you find the median of an even number of values?
To find the median of an even-numbered data set, you must first arrange the numbers in numerical order. Then, identify the two middle values and calculate their arithmetic mean by adding them together and dividing by two.
What does it mean if the mean is higher than the median?
When the mean is higher than the median, the distribution is typically right-skewed (positively skewed). This suggests there are high-value outliers pulling the average toward the right side of the number line.
Is the mean always the most accurate "average"?
The mean is not always the most accurate average because it can be misleading in skewed distributions. While it uses every data point in its calculation, its sensitivity to extremes makes it less reliable than the median in many real-world scenarios.
What is the relationship between mean, median, and mode in a normal distribution?
In a perfectly symmetrical normal distribution, the mean, median, and mode are all located at the exact same point in the center of the curve. This equality is a defining characteristic of a bell curve in statistics, as noted by resources like Khan Academy.
Want unlimited practice questions like these?
Generate AI-powered questions with step-by-step solutions on any topic.
Try Question Generator Free →
Want unlimited practice questions like these?
Generate AI-powered questions with step-by-step solutions on any topic.
Try Question Generator Free →Enjoyed this article?
Share it with others who might find it helpful.