Hard Confidence Interval Practice Questions

Hard Confidence Interval Practice Questions
Mastering basic confidence intervals is one thing, but truly excelling in statistics requires tackling more complex scenarios. This guide is designed to push your understanding with hard confidence interval practice questions that go beyond simple means. You'll work through problems involving differences between groups, proportions, and sample size determination, building the skills needed for advanced coursework and real-world data analysis. A confidence interval provides a powerful way to quantify the uncertainty associated with a sample estimate, and these challenging problems will solidify your ability to apply this crucial concept.
Concept Explanation
A confidence interval is a range of values, derived from sample statistics, that is likely to contain the value of an unknown population parameter. Instead of a single point estimate (like a sample mean), a confidence interval provides a plausible range for the true population parameter (like the true population mean). The confidence level, typically expressed as a percentage (e.g., 95% or 99%), represents the long-run proportion of intervals calculated from repeated sampling that would contain the true parameter. Hard confidence interval problems often involve more complex parameters, such as the difference between two population means, the difference between two population proportions, or require working backward to determine a necessary sample size. These problems may also require using the t-distribution when the population standard deviation is unknown, which is common in practice. For a refresher on the foundational concepts, consider reviewing our introductory confidence interval practice questions.
Solved Examples of Hard Confidence Intervals
These solved examples demonstrate how to calculate and interpret a confidence interval in complex scenarios, including differences between means and sample size determination. Each step is broken down to clarify the process.
Example 1: Confidence Interval for the Difference in Means (Independent Samples, Unknown Variances)
Problem: A researcher wants to compare the effectiveness of two different teaching methods. They randomly assign 20 students to Method A and 25 students to Method B. After a semester, the students take a standardized test. The results are as follows:
-
Method A: Sample size (n₁) = 20, Sample mean (x̄₁) = 85, Sample standard deviation (s₁) = 5
-
Method B: Sample size (n₂) = 25, Sample mean (x̄₂) = 81, Sample standard deviation (s₂) = 6
Assuming the population variances are equal, calculate a 95% confidence interval for the difference between the mean scores of the two methods (μ₁ - μ₂).
Solution:
-
Identify the appropriate formula. Since the population standard deviations are unknown and we are assuming equal variances, we use a two-sample t-interval with a pooled standard deviation. The formula is: (x̄₁ - x̄₂) ± t* ⋅ sp ⋅ √((1/n₁) + (1/n₂))
-
Calculate the pooled standard deviation (sp). This is a weighted average of the two sample variances. sp² = ((n₁ - 1)s₁² + (n₂ - 1)s₂²) / (n₁ + n₂ - 2) sp² = ((20 - 1)5² + (25 - 1)6²) / (20 + 25 - 2) sp² = ((19)(25) + (24)(36)) / 43 sp² = (475 + 864) / 43 = 1339 / 43 ≈ 31.14 sp = √31.14 ≈ 5.58
-
Determine the degrees of freedom (df) and the critical t-value (t*). df = n₁ + n₂ - 2 = 20 + 25 - 2 = 43 For a 95% confidence level with 43 degrees of freedom, we look up the critical t-value. Using a t-distribution table or calculator, t* ≈ 2.017.
-
Calculate the margin of error (ME). ME = t* ⋅ sp ⋅ √((1/n₁) + (1/n₂)) ME = 2.017 ⋅ 5.58 ⋅ √((1/20) + (1/25)) ME = 2.017 ⋅ 5.58 ⋅ √(0.05 + 0.04) ME = 2.017 ⋅ 5.58 ⋅ √0.09 ME = 2.017 ⋅ 5.58 ⋅ 0.3 ≈ 3.37
-
Construct the confidence interval. Interval = (x̄₁ - x̄₂) ± ME Interval = (85 - 81) ± 3.37 Interval = 4 ± 3.37 Interval = (0.63, 7.37)
-
Interpret the result. We are 95% confident that the true difference in mean test scores between Method A and Method B is between 0.63 and 7.37 points. Since the entire interval is positive, this suggests that Method A results in a higher mean score than Method B.
Example 2: Determining Minimum Sample Size for a Proportion
Problem: A political campaign wants to estimate the proportion of voters in a city who support their candidate. They want to be 99% confident that their estimate is within 2 percentage points (±0.02) of the true proportion. A preliminary study suggests the proportion is around 60%. What is the minimum sample size required?
Solution:
-
Identify the formula for sample size for a proportion. n = (Z*² ⋅ p̂(1 - p̂)) / E² Where Z* is the critical value, p̂ is the estimated proportion, and E is the desired margin of error.
-
Determine the critical Z-value (Z*). For a 99% confidence level, the alpha level is α = 0.01. We need the Z-value for α/2 = 0.005 in each tail. The Z-value corresponding to an area of 1 - 0.005 = 0.995 is Z* = 2.576. This is a common value you might find on a Z-score table.
-
Identify the given values. Margin of Error (E) = 0.02 Estimated proportion (p̂) = 0.60
-
Plug the values into the formula and calculate. n = (2.576² ⋅ 0.60(1 - 0.60)) / 0.02² n = (6.635776 ⋅ 0.60(0.40)) / 0.0004 n = (6.635776 ⋅ 0.24) / 0.0004 n = 1.592586 / 0.0004 ≈ 3981.46
-
Round up to the nearest whole number. Since we cannot have a fraction of a person, we always round up to ensure the margin of error is not exceeded. Required sample size (n) = 3982.
Note: If no preliminary estimate (p̂) is available, you should use p̂ = 0.50, as this maximizes the product p̂(1 - p̂) and provides the most conservative (largest) sample size estimate.
Example 3: Confidence Interval for the Difference in Proportions
Problem: A pharmaceutical company tests a new drug. In a clinical trial, 450 patients received the new drug and 400 received a placebo. Of those who received the drug, 375 reported symptom relief. Of those who received the placebo, 300 reported symptom relief. Calculate a 90% confidence interval for the difference in the proportion of patients who experience relief between the drug (p₁) and the placebo (p₂).
Solution:
-
Calculate the sample proportions. p̂₁ (drug) = 375 / 450 = 0.8333 p̂₂ (placebo) = 300 / 400 = 0.75
-
Identify the formula. The confidence interval for the difference between two proportions is: (p̂₁ - p̂₂) ± Z* ⋅ √[ (p̂₁(1 - p̂₁)/n₁) + (p̂₂(1 - p̂₂)/n₂) ]
-
Determine the critical Z-value (Z*). For a 90% confidence level, α = 0.10, so α/2 = 0.05. The Z-value for an area of 0.95 is Z* = 1.645.
-
Calculate the standard error (SE). SE = √[ (0.8333(1 - 0.8333)/450) + (0.75(1 - 0.75)/400) ] SE = √[ (0.8333(0.1667)/450) + (0.75(0.25)/400) ] SE = √[ (0.1389/450) + (0.1875/400) ] SE = √[ 0.0003087 + 0.00046875 ] SE = √0.00077745 ≈ 0.0279
-
Calculate the margin of error (ME). ME = Z* ⋅ SE = 1.645 ⋅ 0.0279 ≈ 0.0459
-
Construct the confidence interval. Interval = (p̂₁ - p̂₂) ± ME Interval = (0.8333 - 0.75) ± 0.0459 Interval = 0.0833 ± 0.0459 Interval = (0.0374, 0.1292)
-
Interpret the result. We are 90% confident that the true difference in the proportion of patients experiencing symptom relief between the drug and the placebo is between 3.74% and 12.92%. Since the interval is entirely above zero, there is strong evidence that the new drug is more effective than the placebo. This type of analysis is closely related to hypothesis testing.
Hard Confidence Interval Practice Questions
The following practice questions will test your ability to construct and analyze confidence intervals in various challenging statistical contexts.
1. (Easy/Medium) A university administrator wants to compare the average GPA of students in the engineering school and the business school. A random sample of 35 engineering students has a mean GPA of 3.25 with a standard deviation of 0.40. A random sample of 40 business students has a mean GPA of 3.40 with a standard deviation of 0.35. Assuming the population variances are unequal, construct a 95% confidence interval for the difference in mean GPA (μbusiness - μengineering). Use the Welch-Satterthwaite equation for degrees of freedom, or a conservative estimate using df = min(n₁-1, n₂-1).
2. (Medium) A market research firm is hired to determine the proportion of teenagers (ages 13-18) who own a specific brand of smartphone. They want to create a 95% confidence interval with a margin of error no greater than 3%. How many teenagers must they survey if they have no prior information about the likely proportion?
3. (Medium) A biologist is studying the effect of a pollutant on the shell thickness of a certain species of snail. They collect a sample of 15 snails from a polluted river and 12 snails from a pristine river. The shell thicknesses (in millimeters) are measured. The summary statistics are:
-
Polluted River: n₁=15, x̄₁=0.78 mm, s₁=0.09 mm
-
Pristine River: n₂=12, x̄₂=0.95 mm, s₂=0.11 mm
Calculate a 99% confidence interval for the difference in mean shell thickness (μpristine - μpolluted). Assume the population variances are equal.
Want unlimited practice questions like these?
Generate AI-powered questions with step-by-step solutions on any topic.
Try Question Generator Free →4. (Hard) An e-commerce company A/B tests two different website checkout designs. 1200 users are shown Design A, and 84 of them complete a purchase. 1150 users are shown Design B, and 92 of them complete a purchase. Construct a 95% confidence interval for the difference in conversion rates (pB - pA). Based on your interval, is there statistically significant evidence that one design is better than the other?
5. (Hard) A fitness trainer wants to test the effectiveness of a new 8-week workout program. They measure the resting heart rate of 10 participants before the program starts and again after it ends. The data (in beats per minute) are as follows:
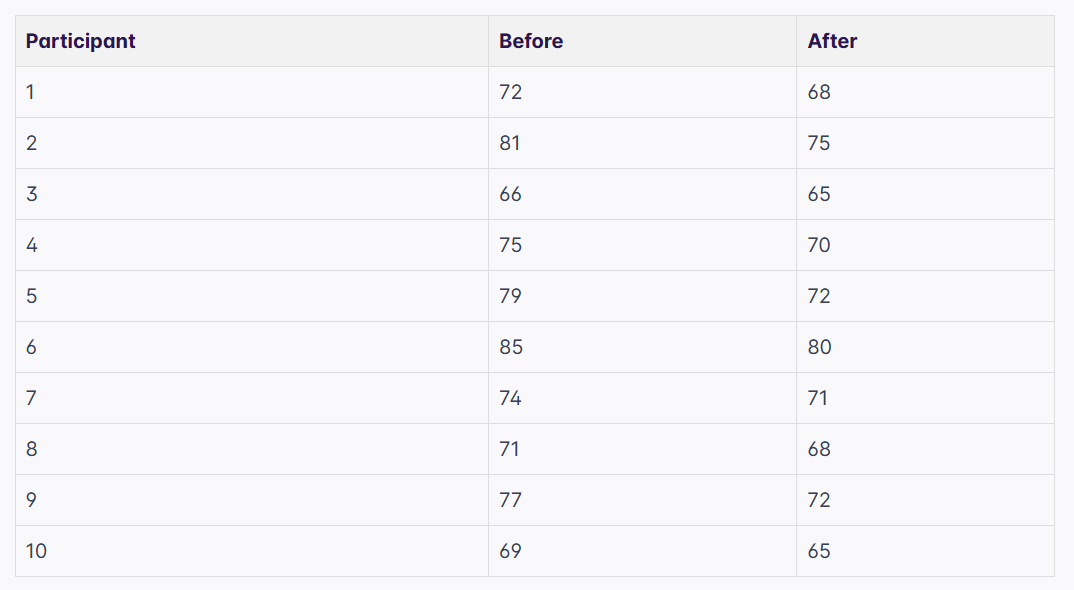
Construct a 90% confidence interval for the mean difference in resting heart rate (μbefore - μafter).
6. (Hard) A researcher develops a 95% confidence interval for the mean height of a newly discovered plant species, which is (34.5 cm, 38.1 cm). The interval was calculated from a sample of 50 plants. Assuming the population standard deviation is known, what was the sample mean and the population standard deviation (σ) used to construct this interval?
7. (Hard) Two different manufacturing processes (Process X and Process Y) are used to create a specific type of resistor. The goal is for the resistance to be 100 ohms. A quality control engineer is interested in the variability of the two processes. They take a sample of 25 resistors from Process X and find a sample variance of 1.44 ohms². They take a sample of 21 resistors from Process Y and find a sample variance of 2.56 ohms². Construct a 95% confidence interval for the ratio of the population variances (σ₁²/σ₂²). (Hint: This requires the F-distribution).
8. (Hard) A 95% confidence interval for the difference between two population means (μ₁ - μ₂) is found to be (-2.5, 4.1). If the sample sizes were n₁=30 and n₂=30, and the confidence level was changed to 99% while everything else remained constant, which of the following could be the new interval? Explain your reasoning without performing the full calculation.
a) (-1.5, 3.1) b) (-2.5, 4.1) c) (-3.7, 5.3) d) (-2.0, 3.6)
Answers & Explanations
This section provides detailed, step-by-step solutions for each of the practice questions, explaining the formulas and reasoning used.
1. Answer & Explanation:
-
Identify the formula. We are comparing two means with unknown and unequal population variances. We use a two-sample t-interval for independent samples: (x̄₂ - x̄₁) ± t* ⋅ √((s₁²/n₁) + (s₂²/n₂)).
-
Calculate the point estimate. The difference in sample means is x̄₂ - x̄₁ = 3.40 - 3.25 = 0.15.
-
Determine degrees of freedom (df). Using the conservative approach, df = min(n₁-1, n₂-1) = min(35-1, 40-1) = min(34, 39) = 34.
-
Find the critical t-value. For a 95% confidence level and df=34, the critical value t* is approximately 2.032.
-
Calculate the standard error and margin of error. SE = √((0.40²/35) + (0.35²/40)) SE = √((0.16/35) + (0.1225/40)) SE = √(0.00457 + 0.00306) = √0.00763 ≈ 0.0873 ME = t* ⋅ SE = 2.032 ⋅ 0.0873 ≈ 0.1774
-
Construct the interval. Interval = 0.15 ± 0.1774 Interval = (-0.0274, 0.3274)
Interpretation: We are 95% confident that the true difference in mean GPA between business and engineering students is between -0.0274 and 0.3274. Since the interval contains zero, there is no statistically significant evidence at the 95% confidence level to conclude that there is a difference in mean GPA between the two schools.
2. Answer & Explanation:
-
Identify the formula. Sample size for a proportion: n = (Z*² ⋅ p̂(1 - p̂)) / E².
-
Determine Z*. For 95% confidence, Z* = 1.96.
-
Determine p̂. Since we have no prior information, we use the most conservative estimate, p̂ = 0.50. This maximizes the required sample size.
-
Identify E. The margin of error is E = 0.03.
-
Calculate n. n = (1.96² ⋅ 0.50(1 - 0.50)) / 0.03² n = (3.8416 ⋅ 0.25) / 0.0009 n = 0.9604 / 0.0009 ≈ 1067.11
-
Round up. We must survey a whole number of people, so we round up to 1068. The firm must survey at least 1068 teenagers.
3. Answer & Explanation:
-
Identify the formula. Two-sample t-interval with assumed equal variances. We need the pooled standard deviation, sp. Interval: (x̄₂ - x̄₁) ± t* ⋅ sp ⋅ √((1/n₁) + (1/n₂))
-
Calculate the pooled standard deviation (sp). sp² = ((15-1)0.09² + (12-1)0.11²) / (15+12-2) sp² = ((14)(0.0081) + (11)(0.0121)) / 25 sp² = (0.1134 + 0.1331) / 25 = 0.2465 / 25 = 0.00986 sp = √0.00986 ≈ 0.0993
-
Determine df and t*. df = n₁ + n₂ - 2 = 15 + 12 - 2 = 25. For 99% confidence and df=25, the critical value t* is 2.787.
-
Calculate the margin of error. ME = 2.787 ⋅ 0.0993 ⋅ √((1/15) + (1/12)) ME = 0.2767 ⋅ √(0.0667 + 0.0833) ME = 0.2767 ⋅ √0.15 = 0.2767 ⋅ 0.3873 ≈ 0.1071
-
Construct the interval. Point estimate = x̄₂ - x̄₁ = 0.95 - 0.78 = 0.17 Interval = 0.17 ± 0.1071 Interval = (0.0629, 0.2771)
Interpretation: We are 99% confident that the true mean shell thickness of snails in the pristine river is between 0.0629 mm and 0.2771 mm greater than that of snails in the polluted river. The interval is entirely positive, providing strong evidence that the pollutant is associated with thinner shells.
4. Answer & Explanation:
-
Calculate sample proportions. p̂A = 84 / 1200 = 0.07 p̂B = 92 / 1150 ≈ 0.08
-
Identify the formula. Confidence interval for the difference between two proportions: (p̂B - p̂A) ± Z* ⋅ √[ (p̂A(1 - p̂A)/nA) + (p̂B(1 - p̂B)/nB) ].
-
Determine Z*. For 95% confidence, Z* = 1.96.
-
Calculate the standard error. SE = √[ (0.07(0.93)/1200) + (0.08(0.92)/1150) ] SE = √[ (0.0651/1200) + (0.0736/1150) ] SE = √[ 0.00005425 + 0.000064 ] = √0.00011825 ≈ 0.01087
-
Calculate the margin of error. ME = 1.96 ⋅ 0.01087 ≈ 0.0213
-
Construct the interval. Point estimate = 0.08 - 0.07 = 0.01 Interval = 0.01 ± 0.0213 Interval = (-0.0113, 0.0313)
Interpretation: We are 95% confident that the true difference in conversion rates (Design B - Design A) is between -1.13% and +3.13%. Since the interval contains zero, we do not have statistically significant evidence to conclude that one design is better than the other. The true difference could be positive, negative, or zero.
5. Answer & Explanation:
-
Recognize paired data. The 'before' and 'after' measurements are on the same 10 individuals, so this is a paired samples problem. We must first calculate the differences for each participant. Let d = Before - After.
-
Calculate the differences (d): 4, 6, 1, 5, 7, 5, 3, 3, 5, 4.
-
Calculate the mean and standard deviation of the differences. Mean of differences (d̄) = (4+6+1+5+7+5+3+3+5+4) / 10 = 43 / 10 = 4.3 Standard deviation of differences (sd): First, find the variance. Σ(dᵢ - d̄)² = (4-4.3)² + ... + (4-4.3)² = (-0.3)² + (1.7)² + (-3.3)² + (0.7)² + (2.7)² + (0.7)² + (-1.3)² + (-1.3)² + (0.7)² + (-0.3)² = 0.09 + 2.89 + 10.89 + 0.49 + 7.29 + 0.49 + 1.69 + 1.69 + 0.49 + 0.09 = 26.09. sd² = 26.09 / (10-1) = 2.8989 sd = √2.8989 ≈ 1.703
-
Identify the formula. Paired t-interval: d̄ ± t* ⋅ (sd / √n).
-
Determine df and t*. df = n - 1 = 10 - 1 = 9. For 90% confidence and df=9, the critical value t* is 1.833.
-
Construct the interval. ME = 1.833 ⋅ (1.703 / √10) = 1.833 ⋅ (1.703 / 3.162) ≈ 0.987 Interval = 4.3 ± 0.987 Interval = (3.313, 5.287)
Interpretation: We are 90% confident that the true mean reduction in resting heart rate after the 8-week program is between 3.31 and 5.29 beats per minute. Since the interval is entirely positive, there is evidence the program is effective at lowering resting heart rate.
6. Answer & Explanation:
-
Find the sample mean (x̄). The sample mean is the midpoint of the confidence interval. x̄ = (34.5 + 38.1) / 2 = 72.6 / 2 = 36.3 cm.
-
Find the margin of error (ME). The margin of error is half the width of the interval. Width = 38.1 - 34.5 = 3.6 cm ME = 3.6 / 2 = 1.8 cm.
-
Use the margin of error formula to solve for σ. The formula for a CI with known σ is x̄ ± Z*(σ/√n). So, ME = Z*(σ/√n). For 95% confidence, Z* = 1.96. We are given n=50. 1.8 = 1.96 ⋅ (σ / √50) 1.8 = 1.96 ⋅ (σ / 7.071) 1.8 ⋅ 7.071 = 1.96 ⋅ σ 12.7278 = 1.96 ⋅ σ σ = 12.7278 / 1.96 ≈ 6.49
Answer: The sample mean was 36.3 cm and the population standard deviation was approximately 6.49 cm.
7. Answer & Explanation:
-
Identify the formula. The confidence interval for the ratio of two population variances is given by: [ (s₁²/s₂²) ⋅ (1/Fα/2, v₁, v₂), (s₁²/s₂²) ⋅ Fα/2, v₂, v₁ ] where v₁ = n₁ - 1 and v₂ = n₂ - 1.
-
Identify the given values. s₁² = 1.44, n₁ = 25 (so v₁ = 24) s₂² = 2.56, n₂ = 21 (so v₂ = 20) Confidence = 95%, so α = 0.05 and α/2 = 0.025.
-
Find the critical F-values. We need two F-values from an F-distribution table or calculator. Purdue University provides F-tables for reference. Fα/2, v₁, v₂ = F0.025, 24, 20 ≈ 2.46 Fα/2, v₂, v₁ = F0.025, 20, 24 ≈ 2.33
-
Calculate the ratio of sample variances. s₁²/s₂² = 1.44 / 2.56 = 0.5625
-
Construct the interval. Lower bound = 0.5625 ⋅ (1 / 2.46) ≈ 0.2287 Upper bound = 0.5625 ⋅ 2.33 ≈ 1.3106
Interval: (0.229, 1.311). Since this interval contains 1, we cannot conclude that there is a significant difference between the variances of the two manufacturing processes at the 95% confidence level.
8. Answer & Explanation:
The correct answer is c) (-3.7, 5.3).
Reasoning: Increasing the confidence level from 95% to 99% means we want to be more certain that our interval captures the true population parameter. To achieve higher certainty, we must cast a wider net. This means the confidence interval must become wider. The critical value (Z* or t*) for 99% confidence is larger than the one for 95% confidence. Since the margin of error is directly proportional to this critical value (ME = critical value * standard error), a larger critical value leads to a larger margin of error and thus a wider interval. Let's analyze the options:
-
a) and d) are narrower than the original interval. This is incorrect.
-
b) is the same interval, which is incorrect.
-
c) is wider than the original interval (-2.5, 4.1). The center of the original interval is (4.1 - 2.5)/2 = 0.8. The center of option c is (5.3 - 3.7)/2 = 0.8. It is wider while maintaining the same center point, which is exactly what we expect when increasing the confidence level.
Quick Quiz
1. This quick quiz offers a rapid check of your understanding of key concepts related to hard confidence interval problems.1. When constructing a confidence interval for a single population mean, when should you use a t-distribution instead of a z-distribution?
- A When the sample size is large (n > 30)
- B When the population standard deviation (σ) is known
- C When the population standard deviation (σ) is unknown and the sample size is relatively small
- D When the data is not normally distributed
Check answer
Answer: C. When the population standard deviation (σ) is unknown and the sample size is relatively small
2. A 95% confidence interval for the difference between two population means (μ₁ - μ₂) is calculated to be (-0.5, 3.5). What is the correct interpretation?
- A There is a 95% probability that the true difference is 1.5.
- B We can be 95% confident that μ₁ is greater than μ₂.
- C We cannot conclude there is a statistically significant difference between the means at the α = 0.05 level.
- D We can be 95% confident that μ₂ is greater than μ₁.
Check answer
Answer: C. We cannot conclude there is a statistically significant difference between the means at the α = 0.05 level.
3. A researcher calculates a 95% confidence interval. To make the interval narrower (more precise) without changing the confidence level, what is the most effective action?
- A Decrease the sample size.
- B Increase the sample size.
- C Use a sample with a larger standard deviation.
- D Switch to a 99% confidence level.
Check answer
Answer: B. Increase the sample size.
4. You are calculating the minimum sample size needed to estimate a population proportion (p) with a desired margin of error. If you have no prior knowledge about the value of p, what value should you use for your estimate (p̂) in the formula?
- A 0
- B 0.25
- C 0.50
- D 1.0
Check answer
Answer: C. 0.50
5. What is the meaning of a "99% confidence level"?
- A There is a 99% chance that the true population parameter is within the calculated interval.
- B If we were to take many random samples and calculate a confidence interval for each, about 99% of those intervals would contain the true population parameter.
- C 99% of the sample data falls within the confidence interval.
- D The sample mean has a 99% chance of being equal to the population mean.
Check answer
Answer: B. If we were to take many random samples and calculate a confidence interval for each, about 99% of those intervals would contain the true population parameter.
Want unlimited practice questions like these?
Generate AI-powered questions with step-by-step solutions on any topic.
Try Question Generator Free →Frequently Asked Questions
Here are answers to some of the most common questions students have about advanced confidence interval calculations.
What is the difference between a z-interval and a t-interval?
The choice between a z-interval and a t-interval depends on whether the population standard deviation (σ) is known. You use a z-interval when σ is known or when the sample size is very large (often n > 30 is used as a rule of thumb, allowing the sample standard deviation 's' to be a good estimate of σ). You must use a t-interval when σ is unknown and you are using the sample standard deviation 's' as an estimate, especially with smaller sample sizes. The t-distribution has heavier tails than the normal (z) distribution to account for the added uncertainty of estimating σ from the sample.
How do I interpret a confidence interval for the difference between two means?
When interpreting a confidence interval for a difference (μ₁ - μ₂), the most important value to look for is zero. If the interval contains zero (i.e., the lower bound is negative and the upper bound is positive), it means that a difference of zero is a plausible value. Therefore, you cannot conclude there is a statistically significant difference between the two population means. If the entire interval is positive, it suggests μ₁ is greater than μ₂. If the entire interval is negative, it suggests μ₂ is greater than μ₁.
Why does a higher confidence level lead to a wider interval?
A higher confidence level (e.g., 99% vs. 95%) implies that you want to be more certain that your interval captures the true population parameter. To achieve this greater certainty, you must allow for a wider range of possible values. Mathematically, a higher confidence level corresponds to a larger critical value (Z* or t*), which in turn increases the margin of error and makes the overall interval wider. There is a direct trade-off between confidence and precision.
What happens to the confidence interval if the sample size increases?
Increasing the sample size makes the confidence interval narrower. The sample size (n) appears in the denominator of the standard error term in all confidence interval formulas. As n gets larger, the standard error gets smaller, which reduces the margin of error. This makes intuitive sense: a larger sample provides more information about the population, reducing uncertainty and allowing for a more precise estimate of the population parameter. The concepts behind this are rooted in the sampling distribution of the statistic.
Can a confidence interval be used for hypothesis testing?
Yes, a confidence interval can be used to perform a two-tailed hypothesis test. For example, to test the null hypothesis H₀: μ₁ - μ₂ = 0 at an alpha level of α = 0.05, you can construct a 95% (which is 1 - α) confidence interval for the difference μ₁ - μ₂. If the interval contains 0, you fail to reject the null hypothesis. If the interval does not contain 0, you can reject the null hypothesis. This provides a range of plausible values in addition to a simple reject/fail-to-reject decision. As noted by Penn State's STAT 200 course, this duality is a fundamental concept in inferential statistics.
What is a pooled standard deviation and when is it used?
A pooled standard deviation (sp) is a weighted average of the standard deviations from two independent samples. It is used when calculating a confidence interval for the difference between two means (a two-sample t-interval) under the assumption that the two populations have equal, but unknown, variances. Pooling the data provides a better single estimate of this common population standard deviation, especially when sample sizes are small or unequal.
Want unlimited practice questions like these?
Generate AI-powered questions with step-by-step solutions on any topic.
Try Question Generator Free →
Want unlimited practice questions like these?
Generate AI-powered questions with step-by-step solutions on any topic.
Try Question Generator Free →Enjoyed this article?
Share it with others who might find it helpful.