Easy Mean, Median, Mode Practice Questions
Easy Mean, Median, Mode Practice Questions
Understanding how to describe the center of a dataset is a fundamental skill in statistics and data analysis. The three most common ways to do this are by calculating the mean, median, and mode. These measures of central tendency each provide a different snapshot of what is 'typical' in a set of numbers. This guide will walk you through the concepts, provide solved examples, and offer plenty of easy mean, median, mode practice questions to help you build a strong foundation.
Concept Explanation
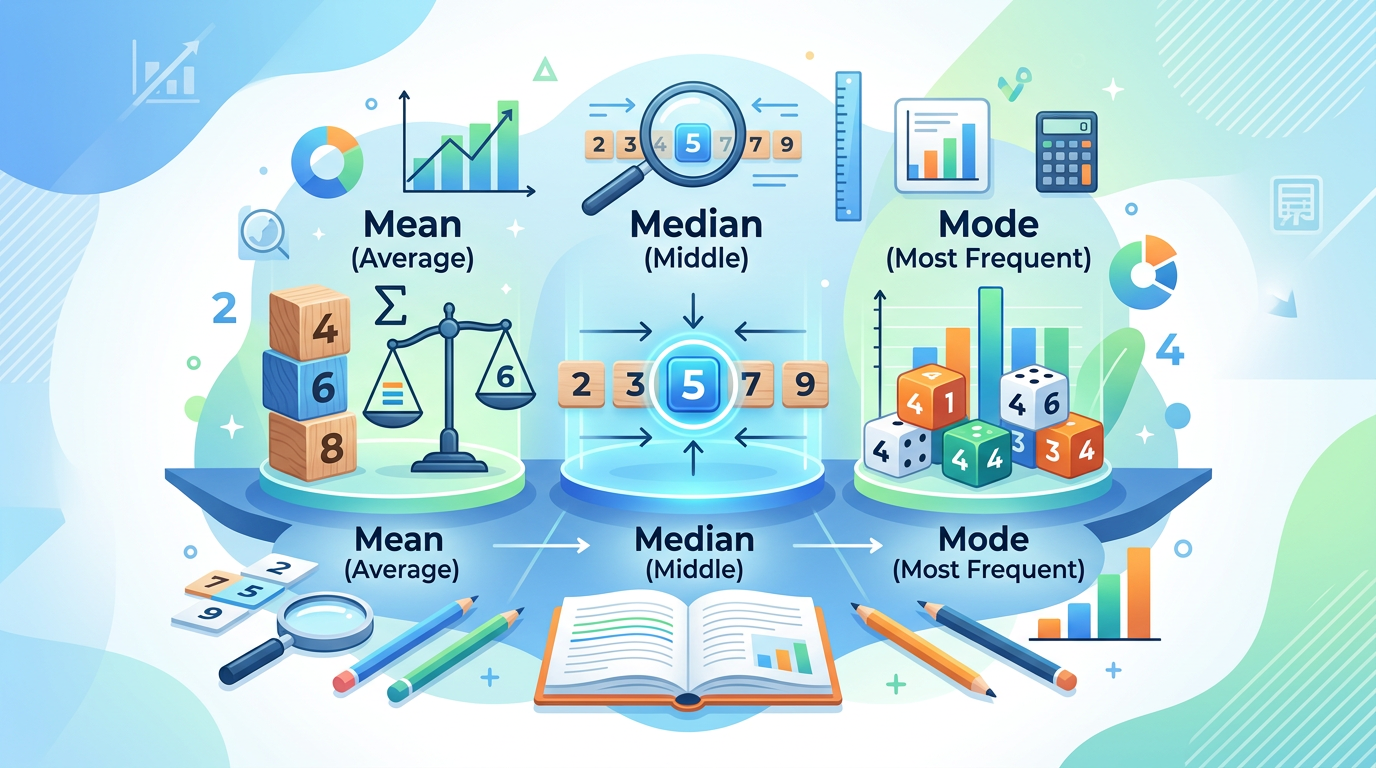
Mean, median, and mode are the three primary measures of central tendency used to describe the center of a dataset. Each one calculates the 'central' value using a different method, which makes them useful in different situations.
What is the Mean?
The mean is the most common measure of central tendency, often referred to as the 'average'. You calculate it by adding up all the values in a dataset and then dividing by the total number of values.
-
Formula: Mean = (Sum of all values) / (Number of values)
-
Best for: Datasets where the numbers are relatively close together without extreme high or low values (called outliers).
What is the Median?
The median is the middle value in a dataset that has been arranged in numerical order (from smallest to largest). The way you find it depends on whether the dataset has an odd or even number of values.
-
For an odd number of values: The median is the single middle number.
-
For an even number of values: The median is the mean of the two middle numbers.
-
Best for: Datasets that have outliers, because the median is not affected by extremely high or low values. For more information on how data is distributed, you can explore resources on normal distribution.
What is the Mode?
The mode is the simplest of the three; it's the value that appears most frequently in a dataset. A dataset can have one mode, more than one mode, or no mode at all.
-
Unimodal: A dataset with one mode.
-
Bimodal: A dataset with two modes.
-
Multimodal: A dataset with more than two modes.
-
No Mode: If no value repeats, the dataset has no mode.
-
Best for: Categorical data (e.g., favorite colors, types of cars) and for identifying the most common value in a set.
Solved Examples of Mean, Median, and Mode
These solved examples demonstrate how to calculate the mean, median, and mode for different types of datasets. Following these step-by-step solutions will clarify the process for each measure.
Example 1: Odd Number of Values
Dataset: {4, 7, 2, 7, 5}
-
Calculate the Mean:
-
Sum the values: 4 + 7 + 2 + 7 + 5 = 25
-
Divide by the number of values (5): 25 / 5 = 5
-
The mean is 5.
-
-
Calculate the Median:
-
First, order the data: {2, 4, 5, 7, 7}
-
Find the middle value. Since there are 5 values, the middle one is the 3rd value.
-
The median is 5.
-
-
Calculate the Mode:
-
Look for the most frequent value in {4, 7, 2, 7, 5}.
-
The number 7 appears twice, more than any other number.
-
The mode is 7.
-
Example 2: Even Number of Values
Dataset: {10, 60, 20, 40, 50, 20}
-
Calculate the Mean:
-
Sum the values: 10 + 60 + 20 + 40 + 50 + 20 = 200
-
Divide by the number of values (6): 200 / 6 ≈ 33.33
-
The mean is approximately 33.33.
-
-
Calculate the Median:
-
Order the data: {10, 20, 20, 40, 50, 60}
-
Since there are 6 values (an even number), find the two middle values: the 3rd and 4th values, which are 20 and 40.
-
Calculate the mean of these two middle values: (20 + 40) / 2 = 30
-
The median is 30.
-
-
Calculate the Mode:
-
Look for the most frequent value in {10, 60, 20, 40, 50, 20}.
-
The number 20 appears twice.
-
The mode is 20.
-
Example 3: Bimodal Dataset
Dataset: {9, 2, 5, 9, 1, 5, 8}
-
Calculate the Mean:
-
Sum the values: 9 + 2 + 5 + 9 + 1 + 5 + 8 = 39
-
Divide by the number of values (7): 39 / 7 ≈ 5.57
-
The mean is approximately 5.57.
-
-
Calculate the Median:
-
Order the data: {1, 2, 5, 5, 8, 9, 9}
-
Find the middle value (the 4th value).
-
The median is 5.
-
-
Calculate the Mode:
-
Look for the most frequent value(s) in {9, 2, 5, 9, 1, 5, 8}.
-
The number 5 appears twice, and the number 9 also appears twice.
-
This dataset is bimodal, and the modes are 5 and 9.
-
Practice Questions
Test your understanding of mean, median, and mode with these practice questions, ranging from easy to medium difficulty. The answers and full explanations are provided in the next section.
1. Find the mean, median, and mode for the following dataset: {15, 12, 18, 15, 10}
2. A student scored the following on five quizzes: 88, 92, 88, 95, 100. What is the mean, median, and mode of their scores?
3. Calculate the mean, median, and mode for this set of numbers: {5, 10, 15, 20, 25, 30}
Want unlimited practice questions like these?
Generate AI-powered questions with step-by-step solutions on any topic.
Try Question Generator Free →4. The daily temperatures (in Celsius) for a week were recorded as: 22, 25, 21, 28, 22, 27, 24. Find the mean, median, and mode temperature.
5. What is the median of the following dataset: {101, 99, 110, 105, 98, 107}?
6. A shoe store sold the following shoe sizes in one hour: 8, 9, 7, 8, 10, 9, 8, 11, 8. What is the mode of the shoe sizes sold?
7. Find the mean and median for the dataset: {3.5, 2.1, 4.0, 5.2, 2.1, 1.7}. Are they the same?
8. The dataset {14, 20, 16, x, 18} has a mean of 17. What is the value of x?
9. Find the mean, median, and mode for the ages of a group of friends: {12, 13, 12, 14, 12, 11}.
10. Which measure of central tendency (mean, median, or mode) would be most appropriate to describe the 'typical' house price in a neighborhood with a few multi-million dollar mansions and many moderately priced homes? Explain why.
Answers & Explanations
Here are the detailed solutions and explanations for the practice questions on mean, median, and mode. Check your work and review the steps to solidify your understanding.
1. Dataset: {15, 12, 18, 15, 10}
-
Mean: (15 + 12 + 18 + 15 + 10) / 5 = 70 / 5 = 14.
-
Median: First, order the data: {10, 12, 15, 15, 18}. The middle value is 15.
-
Mode: The value 15 appears most often (twice).
-
Answer: Mean = 14, Median = 15, Mode = 15.
2. Quiz Scores: {88, 92, 88, 95, 100}
-
Mean: (88 + 92 + 88 + 95 + 100) / 5 = 463 / 5 = 92.6.
-
Median: Order the scores: {88, 88, 92, 95, 100}. The middle score is 92.
-
Mode: The score 88 appears twice.
-
Answer: Mean = 92.6, Median = 92, Mode = 88.
3. Dataset: {5, 10, 15, 20, 25, 30}
-
Mean: (5 + 10 + 15 + 20 + 25 + 30) / 6 = 105 / 6 = 17.5.
-
Median: The data is already ordered. There's an even number of values, so we average the two middle ones (15 and 20). (15 + 20) / 2 = 35 / 2 = 17.5.
-
Mode: No number repeats, so there is no mode.
-
Answer: Mean = 17.5, Median = 17.5, No Mode.
For datasets like this, which are perfectly symmetrical, the mean and median will be the same. Understanding symmetry is a key part of statistics, as explained by resources like Khan Academy's guide on distribution shapes.
4. Temperatures: {22, 25, 21, 28, 22, 27, 24}
-
Mean: (22 + 25 + 21 + 28 + 22 + 27 + 24) / 7 = 169 / 7 ≈ 24.14.
-
Median: Order the temperatures: {21, 22, 22, 24, 25, 27, 28}. The middle value is 24.
-
Mode: The temperature 22 appears most often.
-
Answer: Mean ≈ 24.14°C, Median = 24°C, Mode = 22°C.
5. Dataset: {101, 99, 110, 105, 98, 107}
-
To find the median, first order the data: {98, 99, 101, 105, 107, 110}.
-
There is an even number of values (6), so find the average of the two middle values (101 and 105).
-
(101 + 105) / 2 = 206 / 2 = 103.
-
Answer: The median is 103.
6. Shoe Sizes: {8, 9, 7, 8, 10, 9, 8, 11, 8}
-
The mode is the value that appears most frequently.
-
Count the occurrences: Size 7 (1), Size 8 (4), Size 9 (2), Size 10 (1), Size 11 (1).
-
Size 8 appears 4 times, more than any other size.
-
Answer: The mode is 8.
7. Dataset: {3.5, 2.1, 4.0, 5.2, 2.1, 1.7}
-
Mean: (3.5 + 2.1 + 4.0 + 5.2 + 2.1 + 1.7) / 6 = 18.6 / 6 = 3.1.
-
Median: Order the data: {1.7, 2.1, 2.1, 3.5, 4.0, 5.2}. The middle two values are 2.1 and 3.5. Their average is (2.1 + 3.5) / 2 = 5.6 / 2 = 2.8.
-
Answer: The mean is 3.1 and the median is 2.8. They are not the same. This difference is common in datasets that are not perfectly symmetrical. Measures of spread like variance can help quantify this.
8. Dataset: {14, 20, 16, x, 18}, Mean = 17
-
The mean is the sum divided by the number of values. We know the mean (17) and the number of values (5).
-
(14 + 20 + 16 + x + 18) / 5 = 17
-
(68 + x) / 5 = 17
-
Multiply both sides by 5: 68 + x = 85
-
Subtract 68 from both sides: x = 17.
-
Answer: The value of x is 17.
9. Ages: {12, 13, 12, 14, 12, 11}
-
Mean: (12 + 13 + 12 + 14 + 12 + 11) / 6 = 74 / 6 ≈ 12.33.
-
Median: Order the ages: {11, 12, 12, 12, 13, 14}. The middle two values are both 12. Their average is (12 + 12) / 2 = 12.
-
Mode: The age 12 appears most often (three times).
-
Answer: Mean ≈ 12.33, Median = 12, Mode = 12.
10. House Prices with Outliers
-
The most appropriate measure is the median.
-
Explanation: The mean is heavily influenced by outliers. The few multi-million dollar mansions are outliers that would pull the mean price up, making it seem artificially high and not representative of the 'typical' home. The median, being the middle value, is resistant to these extreme values and would give a much more accurate picture of the price of a typical home in the neighborhood. The Wikipedia article on central tendency provides a good overview of this concept.
Quick Quiz
1. This quick quiz will test your core knowledge of the definitions and basic calculations for mean, median, and mode.1. What is the median of the dataset {3, 8, 1, 9, 4}?
- A 8
- B 1
- C 4
- D 5
Check answer
Answer: C. 4
2. Which measure of central tendency is calculated by adding all values and dividing by the number of values?
- A Median
- B Mean
- C Mode
- D Range
Check answer
Answer: B. Mean
3. What is the mode of the dataset {red, blue, green, blue, yellow, blue}?
- A Red
- B Green
- C Yellow
- D Blue
Check answer
Answer: D. Blue
4. A dataset is {10, 20, 30, 100}. Which measure would be most affected by the value 100?
- A Mean
- B Median
- C Mode
- D All are affected equally
Check answer
Answer: A. Mean
5. A dataset has an even number of values. How is the median found?
- A By picking the larger of the two middle values.
- B By calculating the mean of the two middle values.
- C By picking the smaller of the two middle values.
- D The dataset has no median.
Check answer
Answer: B. By calculating the mean of the two middle values.
Want unlimited practice questions like these?
Generate AI-powered questions with step-by-step solutions on any topic.
Try Question Generator Free →Frequently Asked Questions
Below are answers to some of the most common questions about mean, median, and mode.
What is the main difference between mean and median?
The main difference is how they are calculated and how they are affected by outliers. The mean is the 'average' and is sensitive to extremely high or low values, while the median is the 'middle' value and is not affected by outliers.
When is the median a better measure than the mean?
The median is a better measure than the mean when a dataset has significant outliers or is skewed. For example, when analyzing income or housing prices, where a few very high values can inflate the mean, the median provides a more realistic representation of the typical value.
Can a dataset have more than one mode?
Yes, a dataset can absolutely have more than one mode. If two values appear with the same highest frequency, the dataset is called bimodal. If more than two values share the highest frequency, it is called multimodal.
What if a dataset has no mode?
If every value in a dataset appears only once, there is no mode. This is a perfectly valid outcome. The concept of mode is most useful when there are repeated values to identify a commonality.
How do outliers affect the mean, median, and mode?
Outliers drastically affect the mean by pulling it towards them. They have very little to no effect on the median, as it only depends on the middle position. Outliers generally have no effect on the mode, unless the outlier value itself becomes the most frequent value, which is rare. Understanding outliers is also crucial when working with concepts like Z-scores, which measure how far a data point is from the mean.
Why are they called 'measures of central tendency'?
They are called 'measures of central tendency' because they each try to describe the 'center' or 'typical' value of a probability distribution or dataset. As explained by many university resources, like this one from Laerd Statistics, they summarize a whole set of data with a single, representative number.
Want unlimited practice questions like these?
Generate AI-powered questions with step-by-step solutions on any topic.
Try Question Generator Free →
Want unlimited practice questions like these?
Generate AI-powered questions with step-by-step solutions on any topic.
Try Question Generator Free →Enjoyed this article?
Share it with others who might find it helpful.