SAT Table Practice Questions with Answers
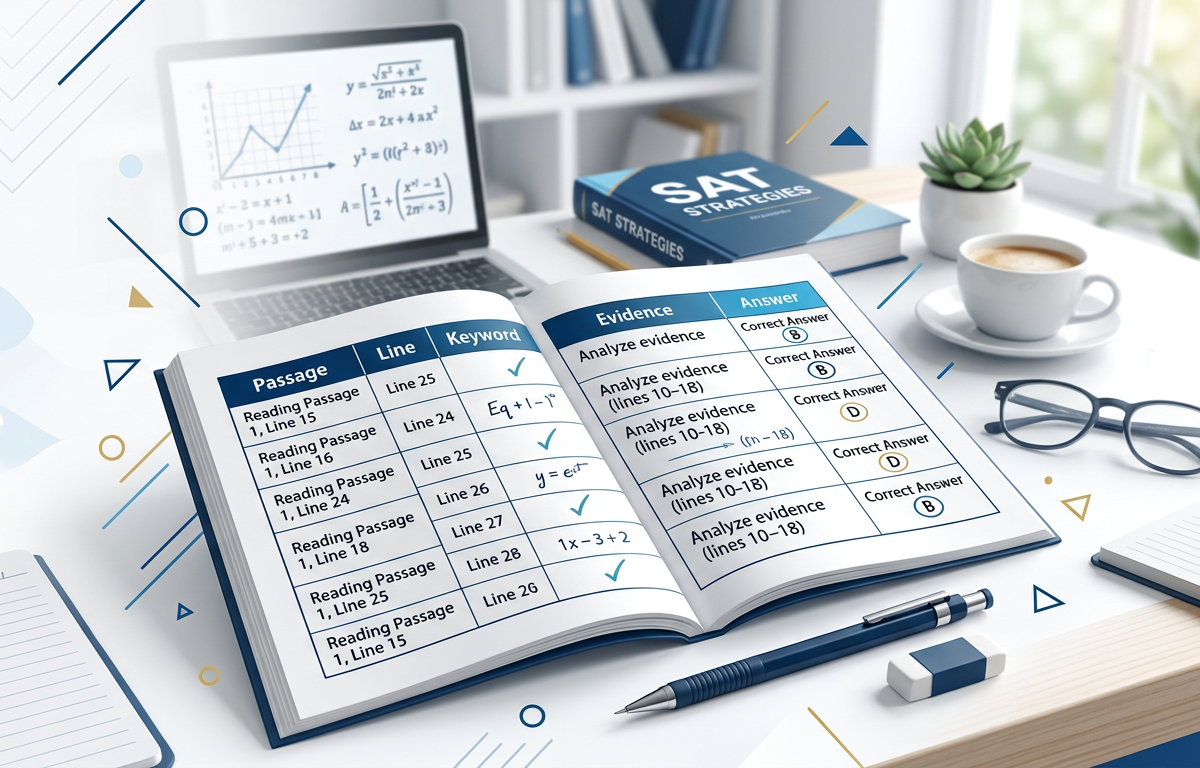
Concept Explanation
An SAT table is a data representation format used to organize information into rows and columns, requiring students to interpret, analyze, and perform calculations based on the provided values. These tables often appear in the Heart of Algebra and Problem Solving and Data Analysis sections of the exam. To master SAT table practice questions, you must understand how to navigate two-way tables, which show frequencies for two categorical variables. For instance, a table might display student preferences for lunch options categorized by grade level. Success on these questions depends on your ability to identify the correct "cell" or "total" required by the prompt. You will often be asked to calculate probabilities, proportions, or rates. A common trap involves the denominator in probability questions; you must distinguish between the probability of the entire group versus a specific subset (conditional probability). According to Khan Academy, reading the labels and units carefully is the most critical step in avoiding calculation errors. Many questions also integrate concepts found in SAT percentage word practice questions, requiring you to convert table data into percentage increases or decreases.
Solved Examples
Review these step-by-step solutions to understand how to approach SAT table problems effectively.
- Example 1: Basic Probability
Question: If a person is chosen at random from Group A, what is the probability that they failed?Group Passed Failed Total Group A 45 5 50 Group B 38 12 50 Total 83 17 100 - Identify the condition: The person must be from Group A. This means our denominator is the total for Group A, which is .
- Identify the numerator: The number of people in Group A who failed is .
- Calculate the probability: or .
- Example 2: Conditional Probability
Using the same table above: If a person who passed is chosen at random, what is the probability they were in Group B?
- Identify the condition: The person must have passed. Our denominator is the total number of people who passed, which is .
- Identify the numerator: The number of people in Group B who passed is .
- Calculate the probability: .
- Example 3: Rate Calculation
Question: Based on the table, what is the constant speed of the car in miles per hour?Time (hours) Distance (miles) 2 130 5 325 - Recall the formula for speed: .
- Use the first row: mph.
- Verify with the second row: mph. The speed is constant at mph.
Practice Questions
Test your skills with these SAT table practice questions. Ensure you read the constraints of each question carefully.
1. The table below shows the results of a survey regarding favorite movie genres among 200 students.
| Genre | 9th Grade | 10th Grade | Total |
|---|---|---|---|
| Action | 40 | 30 | 70 |
| Comedy | 25 | 35 | 60 |
| Drama | 35 | 35 | 70 |
| Total | 100 | 100 | 200 |
If a 10th-grade student is chosen at random, what is the probability that their favorite genre is Action?
2. A research study tracked the growth of a plant over several weeks.
| Week | Height (cm) |
|---|---|
| 0 | 5.0 |
| 2 | 8.6 |
| 4 | 12.2 |
If the plant's height increases linearly, what is the predicted height, in centimeters, at Week 10?
3. A local bakery recorded the number of muffins sold over two days.
| Type | Monday | Tuesday | Total |
|---|---|---|---|
| Blueberry | 15 | 25 | 40 |
| Bran | 10 | 10 | 20 |
| Total | 25 | 35 | 60 |
What fraction of the muffins sold on Tuesday were Bran muffins?
4. Refer to the movie genre table in Question 1. What percentage of the students who chose Comedy as their favorite genre are in the 9th grade?
5. The following table displays the results of a clinical trial for a new medication.
| Result | Medication | Placebo | Total |
|---|---|---|---|
| Improved | 120 | 40 | 160 | 30 | 60 | 90 |
| Total | 150 | 100 | 250 |
If a person from the study is chosen at random and they did NOT improve, what is the probability they were given the medication?
6. A car dealership has the following inventory of cars based on color and type.
| Color | Sedan | SUV | Total |
|---|---|---|---|
| White | 12 | 18 | 30 |
| Black | 20 | 10 | 30 |
| Silver | 15 | 25 | 40 |
| Total | 47 | 53 | 100 |
What is the ratio of White SUVs to Silver Sedans in the inventory?
7. Using the dealership table above, what fraction of all SUVs in the inventory are Black?
8. A linear function is defined by several values in the table below.
| 1 | 7 |
| 3 | 13 |
| 5 | 19 |
What is the value of ? (Hint: You may find SAT linear equations practice questions helpful for this logic.)
9. A survey asked 500 people about their primary news source.
| Source | Under 30 | 30 and Over | Total |
|---|---|---|---|
| Social Media | 180 | 40 | 220 |
| Television | 20 | 150 | 170 |
| Other | 50 | 60 | 110 |
| Total | 250 | 250 | 500 |
What is the probability that a person chosen at random is 30 and Over AND uses Social Media as their primary news source?
10. Based on the news source table, what percentage of the "Under 30" group uses Television or "Other" sources?
Answers & Explanations
- Answer: or . The question specifies a 10th-grade student is chosen, so the denominator is the 10th-grade total (). The number of 10th graders who like Action is . Therefore, .
- Answer: . First, find the rate of change: cm per week. The linear equation is . For Week 10: .
- Answer: . The condition is muffins sold on Tuesday (). The number of Bran muffins on Tuesday is . The fraction is , which simplifies to .
- Answer: (approx). Total Comedy students = . 9th-grade Comedy students = . Divide . Multiply by 100 to get .
- Answer: . The condition is "did NOT improve." The total for "No Change" is . The number of people in that group who took medication is . The probability is .
- Answer: . White SUVs = . Silver Sedans = . The ratio is , which simplifies to .
- Answer: . The total number of SUVs is . The number of Black SUVs is . The fraction is .
- Answer: . Find the slope: . Using : . Since is the -intercept, the answer is .
- Answer: or . The group is "a person chosen at random" from the whole study, so the denominator is . The specific cell is "30 and Over" and "Social Media," which is . .
- Answer: . The total Under 30 group is . The number using TV or Other is . , or .
1. In a two-way table, if a question asks for the probability that a "selected participant who is a woman" prefers tea, what should be the denominator?
Frequently Asked Questions
What is a two-way table on the SAT?
A two-way table, or contingency table, is a grid used to summarize the relationship between two categorical variables. It allows you to see how frequencies are distributed across different combinations of categories, such as gender and voting preference.
How do I calculate conditional probability from a table?
To find conditional probability, restrict your focus to the specific row or column mentioned in the condition. Use the total of that specific row or column as your denominator and the value in the target cell as your numerator.
Can SAT table questions involve algebra?
Yes, many table questions require you to find the equation of a line or a rate of change based on the data provided. You can apply techniques from SAT systems of equations practice questions if a table provides multiple unknown variables.
What is the most common mistake students make with tables?
The most frequent error is using the "Grand Total" as the denominator when the question actually asks for a subset or a conditional probability. Always double-check if the question says "given that..." or "of the [specific group]..." to identify the correct total.
Are calculators allowed for table questions?
Calculators are allowed on the Digital SAT Math section, which is where most data analysis and table questions appear. Using a calculator is recommended for complex divisions or converting fractions to percentages to ensure accuracy.
How do I handle tables with missing values?
If a table has missing values but provides row or column totals, use subtraction to find the missing data. For example, if the total is 100 and you know two of the three cells in that row are 30 and 40, the missing cell must be 30.
Enjoyed this article?
Share it with others who might find it helpful.
Related Articles

Hard SAT Table Practice Questions
Hard SAT Table Practice Questions
Apr 27, 2026

Medium SAT Table Practice Questions
Medium SAT Table Practice Questions
Apr 27, 2026

Easy SAT Table Practice Questions
Improve your SAT score with our guide on Easy SAT Table Practice Questions. Learn how to read data, calculate probabilities, and solve problems step-by-step.
Apr 27, 2026

SAT Probability: Navigating Conditional Data and Table Traps
SAT Probability Practice Questions with Answers
Apr 27, 2026
Solving High-Level SAT Integer Logic and Number Theory Problems
Hard SAT Integers Practice Questions
Apr 27, 2026

Hard SAT Number Properties Practice Questions
Hard SAT Number Properties Practice Questions
Apr 27, 2026

Defeating Extraneous Solutions and Rational Exponents on the SAT
Hard SAT Radicals Practice Questions
Apr 27, 2026

Hard SAT Exponents Practice Questions
Hard SAT Exponents Practice Questions
Apr 27, 2026