SAT Standard Deviation: How to Compare Data Spread Without Math
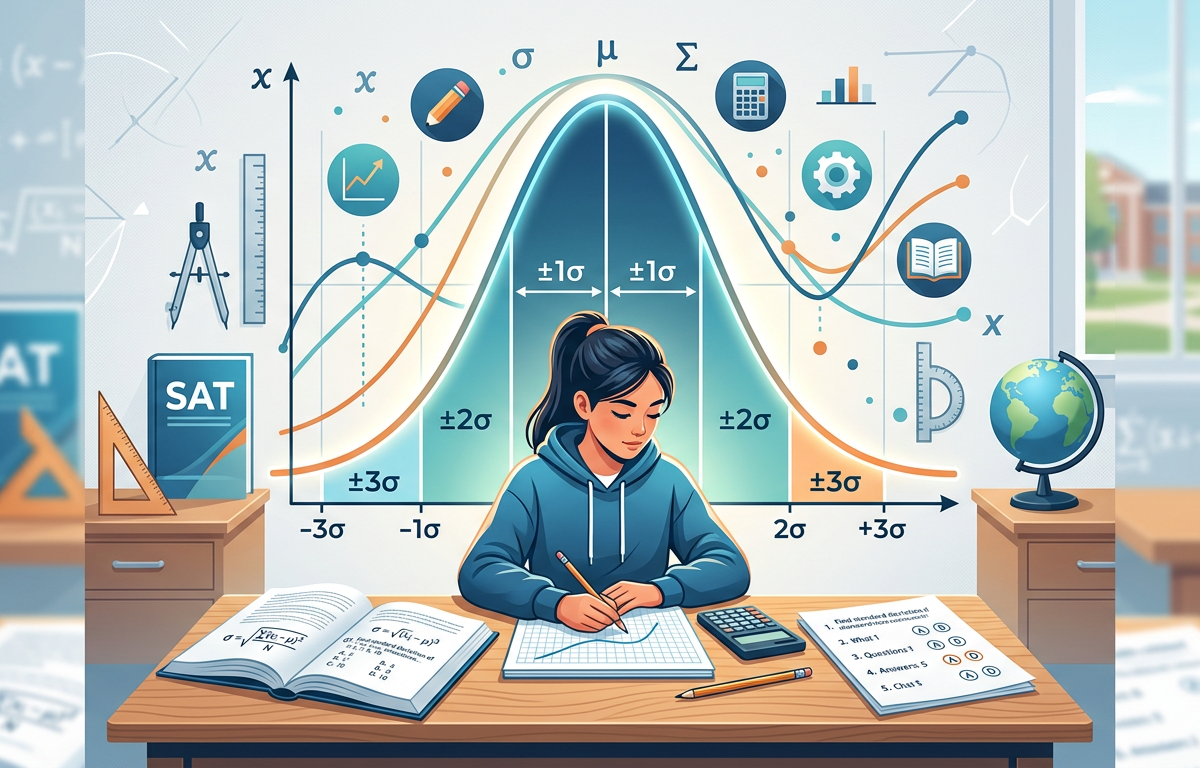
Imagine two quiz groups. Group A scores are all exactly 85. Group B scores range from 70 to 100, though the average is also 85. On the SAT, you do not need the square root of the variance to tell these apart. Students often lose time trying to calculate sigma manually, but the College Board is actually testing your ability to visualize density versus dispersion. If every data point sits right on the mean, the standard deviation is zero. As soon as you move points away from that center, the value grows.
A common trap involves shifting data sets. If you add 10 points to every student's score, the entire bell curve slides to the right, but the shape of the curve does not change. Because the relative distance between the points remains identical, the standard deviation stays exactly the same. This guide focuses on the specific logic of data clusters and how to instantly recognize which histogram represents a more volatile set of numbers without touching your calculator.
Visualizing Spread and Data Consistency
Standard deviation is a statistical measure that quantifies the amount of variation or dispersion in a set of data values relative to the mean. In the context of the SAT, you are rarely asked to calculate the exact numerical value using the formal formula; instead, you must understand that a low standard deviation indicates that the data points tend to be very close to the mean, while a high standard deviation indicates that the data points are spread out over a wider range of values.
When comparing two data sets on the SAT, look for the "spread." If two sets have the same mean, the set with values clustered tightly around that mean has a smaller standard deviation. Conversely, the set with values pushed toward the extremes (far from the center) has a larger standard deviation. This concept is frequently paired with other statistical measures like the range, median, and mean, which you can explore further in our guide on SAT Math Practice Questions Set 3. You might also find similarities in how data is interpreted in SAT Word Problems Practice Questions.
Key rules to remember for the SAT:
- Adding/Subtracting: If you add or subtract the same constant to every value in a data set, the standard deviation remains unchanged because the spread stays the same.
- Multiplying/Dividing: If you multiply every value by a constant , the standard deviation is multiplied by .
- Outliers: Adding an outlier (a value very far from the mean) will almost always increase the standard deviation.
For more information on the mathematical foundations of this concept, you can visit Khan Academy's guide on standard deviation or check the Wikipedia page on Standard Deviation.
Solved Examples
Example 1: Conceptual Comparison
Data Set A: {10, 10, 10, 10, 10}
Data Set B: {5, 10, 15, 10, 10}
Which data set has a larger standard deviation?
- Identify the mean of both sets. For Set A, the mean is 10. For Set B, the mean is .
- Observe the spread. In Set A, every value is exactly the mean. There is zero variation.
- In Set B, some values (5 and 15) are distant from the mean.
- Conclusion: Data Set B has a larger standard deviation because the data is more spread out.
Example 2: Frequency Tables
Two groups of students took a 5-point quiz. Group 1 scores: {3, 3, 3, 3, 3}. Group 2 scores: {1, 1, 3, 5, 5}. Which group has the smaller standard deviation?
- Look at Group 1. All students scored exactly the same. The spread is zero.
- Look at Group 2. Scores are spread from the minimum to the maximum possible values.
- A set with no variation always has the smallest possible standard deviation (0).
- Conclusion: Group 1 has the smaller standard deviation.
Example 3: Transformations
A set of heights has a standard deviation of 4 inches. If every person in the group grows by exactly 2 inches, what is the new standard deviation?
- Identify the change: Every value in the set is increased by a constant (+2).
- Recall the rule: Adding a constant to all values shifts the mean but does not change the distance between the points.
- The "spread" remains identical to the original set.
- Conclusion: The new standard deviation is still 4 inches.
Practice Questions
1. Data Set X consists of the values {20, 21, 22, 23, 24}. Data Set Y consists of the values {10, 15, 22, 29, 34}. Which statement is true regarding the standard deviations of the two sets?
2. A list of 10 numbers has a mean of 50 and a standard deviation of 5. If a new number, 50, is added to the list, will the standard deviation increase, decrease, or stay the same?
3. Two histograms show the distribution of test scores for Class A and Class B. Both classes have a mean score of 85. Class A's scores are mostly concentrated between 80 and 90. Class B's scores are evenly distributed between 70 and 100. Which class has the higher standard deviation?
4. Set L: {100, 200, 300, 400, 500}. Set M: {101, 201, 301, 401, 501}. Compare the standard deviations of Set L and Set M.
5. A scientist measures the weights of 100 pebbles. The standard deviation is 0.5 grams. If the scientist converts all measurements from grams to milligrams (by multiplying each value by 1,000), what is the new standard deviation in milligrams?
6. Consider two sets of data:
Set P: {5, 5, 5, 15, 15, 15}
Set Q: {5, 6, 7, 13, 14, 15}
Which set has the larger standard deviation?
7. If the standard deviation of a data set is 0, what must be true about the values in that data set?
8. A teacher decides to curve a test by adding 5 points to every student's score. How does this affect the range and the standard deviation of the scores? (Hint: Check SAT Percentage Word Practice Questions for similar logic on adjustments).
9. Set A contains 5 consecutive integers. Set B contains 5 consecutive even integers. Which set has a larger standard deviation?
10. A data set has a mean of 10 and a standard deviation of 2. If every value in the data set is doubled, what are the new mean and the new standard deviation?
Answers & Explanations
- Set Y has a larger standard deviation. In Set X, the values are consecutive and very close to each other (range of 4). In Set Y, the values are much more spread out (range of 24). Since standard deviation measures spread, Set Y is higher.
- The standard deviation will decrease. Standard deviation measures the average distance from the mean. Since the new value (50) is exactly equal to the mean, it has a distance of 0 from the mean. Adding a value with 0 deviation pulls the "average deviation" down.
- Class B has the higher standard deviation. Standard deviation is higher when more data points are located far away from the mean. Class B has scores reaching out to 70 and 100, whereas Class A is tightly packed around the mean of 85.
- The standard deviations are equal. Set M is simply Set L with 1 added to every value. Adding a constant does not change the spread or the standard deviation.
- 500 milligrams. When every value in a set is multiplied by a constant , the standard deviation is also multiplied by . .
- Set P has the larger standard deviation. In Set P, all values are at the extreme ends (5 or 15), which are 5 units away from the mean of 10. In Set Q, several values (6, 7, 13, 14) are closer to the mean than the values in Set P. More points far from the mean equals higher standard deviation.
- All values in the data set are identical. Standard deviation is 0 if and only if there is no variation at all.
- Both remain unchanged. Adding a constant to every value shifts the entire distribution but does not stretch or compress it. Thus, the distance between the max and min (range) and the average spread (standard deviation) stay the same.
- Set B. Consecutive integers are 1 unit apart (e.g., 1, 2, 3, 4, 5). Consecutive even integers are 2 units apart (e.g., 2, 4, 6, 8, 10). Because the values in Set B are more spread out, the standard deviation is larger.
- Mean = 20, Standard Deviation = 4. Doubling every value doubles the mean and also doubles the spread (standard deviation).
1. Which of the following changes to a data set will always increase the standard deviation?
Frequently Asked Questions
Do I need to know the standard deviation formula for the SAT?
No, you do not need to memorize or use the complex formula involving square roots and sums of squares. The SAT focuses on your ability to compare the spread of two different data sets visually or logically.
How does an outlier affect the standard deviation?
An outlier is a data point that is significantly higher or lower than the rest of the values. Adding an outlier increases the standard deviation because it increases the total spread and the average distance of points from the mean.
What is the difference between range and standard deviation?
Range is a simple calculation of the difference between the maximum and minimum values, while standard deviation considers how every single data point in the set is distributed around the mean.
If two sets have the same mean, do they have the same standard deviation?
Not necessarily. Two sets can have the same average (mean) but very different distributions; one could be tightly clustered (low standard deviation) while the other is widely dispersed (high standard deviation).
Can standard deviation be negative?
Standard deviation can never be negative because it is calculated based on squared distances, which are always non-negative, and the final result is a principal square root.
How is standard deviation shown on a box plot?
Standard deviation isn't directly shown as a specific line on a box plot, but a wider box and longer whiskers generally suggest a higher standard deviation compared to a narrower plot.
Enjoyed this article?
Share it with others who might find it helpful.
Related Articles

Hard SAT Standard Deviation Practice Questions
Hard SAT Standard Deviation Practice Questions
Apr 27, 2026
Medium SAT Standard Deviation Practice Questions
Medium SAT Standard Deviation Practice Questions
Apr 27, 2026
Easy SAT Standard Deviation Practice Questions
Easy SAT Standard Deviation Practice Questions
Apr 27, 2026

SAT Probability: Navigating Conditional Data and Table Traps
SAT Probability Practice Questions with Answers
Apr 27, 2026

Hard SAT Probability Practice Questions
Hard SAT Probability Practice Questions
Apr 27, 2026

Solving Weighted Averages and Median Shifts on the Digital SAT
Hard SAT Mean Median Mode Practice Questions
Apr 27, 2026

SAT Stats: Solving for Margin of Error and Skewed Distributions
Hard SAT Statistics Practice Questions
Apr 27, 2026

Medium SAT Probability Practice Questions
Medium SAT Probability Practice Questions
Apr 27, 2026