Medium SAT Standard Deviation Practice Questions
Concept Explanation
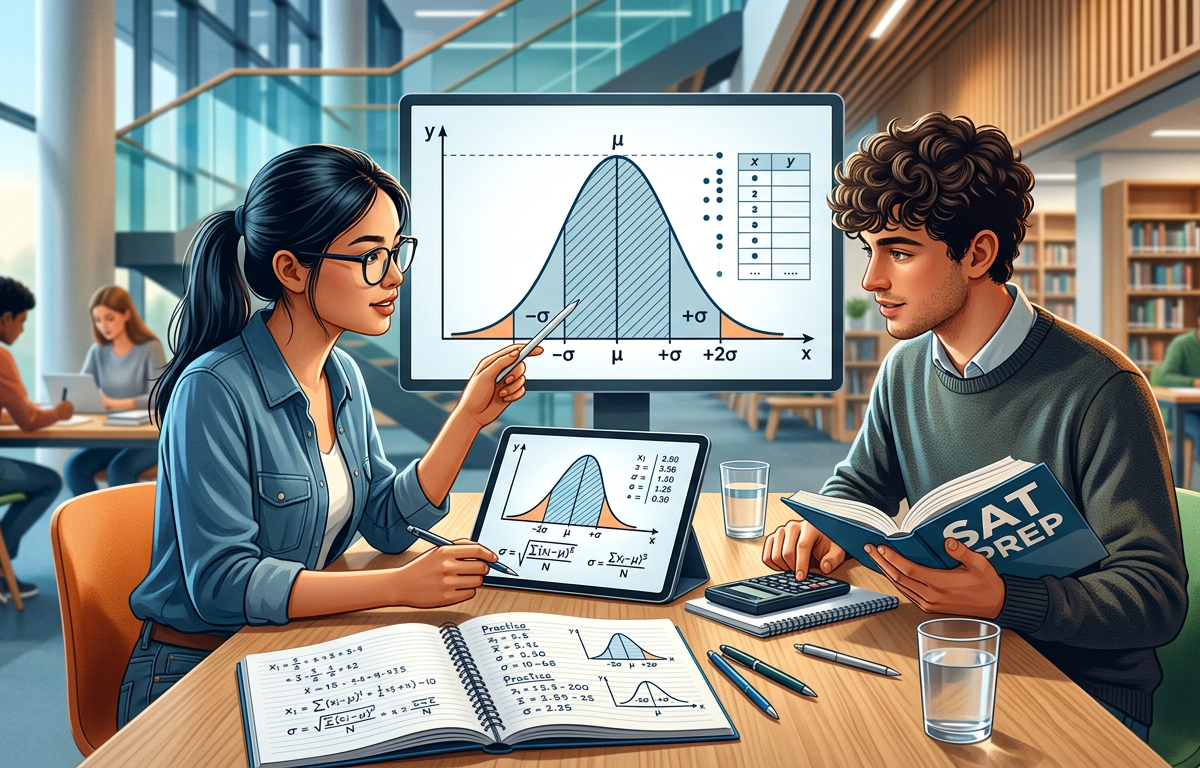
Standard deviation is a statistical measure that quantifies the amount of variation or dispersion in a set of data values relative to the mean. On the SAT, you are rarely required to calculate the exact numerical value of standard deviation using complex formulas; instead, the test focuses on your ability to interpret what standard deviation represents: how "spread out" the data points are from the average. A low standard deviation indicates that the data points tend to be very close to the mean, while a high standard deviation indicates that the data points are spread out over a wider range of values.
When analyzing standard deviation on the SAT, you should look for the "density" of the data. If the majority of values are clustered tightly around the center, the standard deviation is small. If the values are pushed toward the extremes (the "tails" of the distribution), the standard deviation is large. It is helpful to understand this in the context of other statistical measures, such as those found in Medium SAT Word Problems Practice Questions. Remember that adding the same constant to every value in a data set changes the mean but leaves the standard deviation unchanged, while multiplying every value by a constant changes both the mean and the standard deviation.
Key properties to remember for the SAT Math section:
- Spread: More spread equals higher standard deviation.
- Consistency: More consistency (values closer together) equals lower standard deviation.
- Outliers: Extreme values far from the mean increase the standard deviation significantly.
- Frequency: In a histogram, if the tallest bars are in the middle, standard deviation is likely lower than if the tallest bars are at the edges.
Solved Examples
Example 1: Data Set A consists of the numbers {10, 10, 10, 10, 10}. Data Set B consists of the numbers {8, 9, 10, 11, 12}. Which data set has a larger standard deviation?
- Calculate the mean for both sets. For Set A, the mean is 10. For Set B, the mean is .
- Observe the distance of each point from the mean. In Set A, every point is exactly the mean (distance = 0).
- In Set B, points vary from the mean (distances are 2, 1, 0, 1, 2).
- Since Set B has values that are spread out from the mean while Set A has no spread, Data Set B has a larger standard deviation.
Example 2: A teacher has two classes, Class X and Class Y. The test scores for Class X range from 70 to 90, with most students scoring 80. The test scores for Class Y range from 50 to 100, with scores evenly distributed. Which class likely has a smaller standard deviation?
- Identify the spread of the data. Class X has a range of 20 points (90 - 70).
- Class Y has a range of 50 points (100 - 50).
- Class X's scores are more tightly clustered around the center (80).
- Because Class X has less variation and scores are closer to the mean, Class X has a smaller standard deviation.
Example 3: If every value in a data set with a standard deviation of 5 is increased by 10, what is the new standard deviation?
- Understand the transformation. Adding 10 to every value shifts the entire distribution to the right on a number line.
- Observe that the relative distance between the points remains exactly the same.
- Since standard deviation measures the distance between points and the mean, and that distance hasn't changed, the standard deviation remains constant.
- The new standard deviation is 5.
Practice Questions
1. Two sets of data, Set P and Set Q, are shown below. Which statement is true regarding their standard deviations?
Set P: {2, 4, 6, 8, 10}
Set Q: {102, 104, 106, 108, 110}
2. A survey of the heights of 100 players on two different basketball teams was conducted. Team A has a mean height of 78 inches and a standard deviation of 2 inches. Team B has a mean height of 78 inches and a standard deviation of 5 inches. Which team has more players with heights significantly different from the mean?
3. Consider two dot plots. Plot A has 10 dots clustered at the value 50. Plot B has 5 dots at 40 and 5 dots at 60. Which plot has a standard deviation of 0?
4. Data set R contains the values {5, 5, 10, 15, 15}. Data set S contains the values {5, 6, 10, 14, 15}. Which data set has the larger standard deviation?
5. A list of 10 integers has a mean of 25 and a standard deviation of 4. If each integer is multiplied by 2, what is the new standard deviation?
6. Two frequency histograms represent the ages of residents in two different apartment complexes. Histogram 1 is bell-shaped with a peak at 30 years. Histogram 2 is flat (uniform), with an equal number of residents at every age from 20 to 40. Which histogram represents a larger standard deviation?
7. If an outlier that is much larger than the mean is added to a data set, how will the standard deviation change?
8. Set M = {10, 20, 30, 40, 50}. Set N = {20, 25, 30, 35, 40}. Compare the standard deviations of Set M and Set N.
9. A scientist measures the temperature of a liquid every hour. If the temperatures recorded are {20, 21, 20, 22, 21} degrees Celsius, and then the thermometer is recalibrated by adding 2 degrees to every reading, how does the standard deviation of the new set compare to the old set?
10. Which of the following sets of numbers has the smallest standard deviation?
Set A: {1, 2, 3, 4, 5}
Set B: {1, 1, 3, 5, 5}
Set C: {3, 3, 3, 3, 3}
Set D: {0, 3, 3, 3, 6}
Answers & Explanations
1. The standard deviations are equal. Although the values in Set Q are much larger than those in Set P, the spread between the numbers is identical. Both sets have values that are exactly 2 units apart. Since standard deviation measures spread, not magnitude, they are the same.
2. Team B. Standard deviation measures the average distance from the mean. A higher standard deviation (5 inches vs 2 inches) indicates that Team B's heights are more spread out, meaning more players have heights that deviate significantly from the 78-inch average.
3. Plot A. Standard deviation is 0 only when all data points are identical. In Plot A, every single dot is at 50, so there is no deviation from the mean. In Plot B, the dots are spread out at 40 and 60, resulting in a positive standard deviation.
4. Data Set R. In Set R, four of the five values are at the extreme ends of the range (5 and 15). In Set S, the values {6, 14} are closer to the mean of 10 than the values {5, 15} in Set R. Because Set R has more "weight" at the edges of the distribution, it has a larger standard deviation.
5. 8. Unlike addition, multiplication scales the spread of the data. If every value is doubled, the distance between each point and the mean also doubles. Therefore, the standard deviation is multiplied by the same factor: .
6. Histogram 2. In a bell-shaped distribution (Histogram 1), most data points are clustered near the mean (30). In a uniform distribution (Histogram 2), the data is spread out evenly across the entire range. More data points further from the mean results in a larger standard deviation.
7. The standard deviation will increase. Standard deviation is highly sensitive to outliers. Adding a value that is far from the mean increases the "average distance" of all points from the mean, thereby increasing the standard deviation. This concept is often tested alongside Medium SAT Algebra Word Practice Questions.
8. Set M has a larger standard deviation. Both sets have a mean of 30. However, the values in Set M ({10, 20, 30, 40, 50}) are more spread out than the values in Set N ({20, 25, 30, 35, 40}). The range of Set M is 40, while the range of Set N is 20.
9. The standard deviation remains the same. Adding a constant value to every data point shifts the mean but does not change the distances between the data points. Therefore, the spread remains identical.
10. Set C. Set C has a standard deviation of 0 because all values are identical. Any variation in a set (as seen in A, B, and D) will result in a standard deviation greater than zero. For more practice with numeric sets, see our Medium SAT Ratio and Proportion Practice Questions.
1. Which of the following changes to a data set will ALWAYS increase the standard deviation?
Frequently Asked Questions
What does standard deviation tell you on the SAT?
On the SAT, standard deviation tells you how spread out the data is from the mean. You will mostly be asked to compare the standard deviations of two different graphs or data sets rather than calculating a specific number.
Does adding a constant to every value change the standard deviation?
No, adding or subtracting the same constant from every value in a data set does not change the standard deviation. This is because the relative distances between the data points remain the same, even though the mean shifts.
How do outliers affect standard deviation?
Outliers significantly increase the standard deviation. Because standard deviation measures the average distance from the mean, a single point very far away pulls the average distance higher.
What is the difference between range and standard deviation?
Range is simply the difference between the highest and lowest values, while standard deviation considers how every single data point in the set relates to the mean. A set can have a large range but a small standard deviation if most points are clustered in the middle.
Can standard deviation be negative?
No, standard deviation can never be negative because it is calculated based on squared distances. The smallest possible value for standard deviation is zero, which occurs when all data points in a set are identical.
How can I identify the set with the highest standard deviation on a histogram?
Look for the histogram where the data is most spread out toward the horizontal edges. If a histogram has high frequencies at the far left and far right and low frequencies in the middle, it will have a much higher standard deviation than a bell-shaped histogram.
Enjoyed this article?
Share it with others who might find it helpful.
Related Articles

Hard SAT Standard Deviation Practice Questions
Hard SAT Standard Deviation Practice Questions
Apr 27, 2026
Easy SAT Standard Deviation Practice Questions
Easy SAT Standard Deviation Practice Questions
Apr 27, 2026

SAT Standard Deviation: How to Compare Data Spread Without Math
SAT Standard Deviation Practice Questions with Answers
Apr 27, 2026

Hard SAT Probability Practice Questions
Hard SAT Probability Practice Questions
Apr 27, 2026

Solving Weighted Averages and Median Shifts on the Digital SAT
Hard SAT Mean Median Mode Practice Questions
Apr 27, 2026

SAT Stats: Solving for Margin of Error and Skewed Distributions
Hard SAT Statistics Practice Questions
Apr 27, 2026

Medium SAT Probability Practice Questions
Medium SAT Probability Practice Questions
Apr 27, 2026

Medium SAT Statistics Practice Questions
Medium SAT Statistics Practice Questions
Apr 27, 2026