Hard SAT Standard Deviation Practice Questions

Hard SAT Standard Deviation Practice Questions
Standard deviation is a statistical measure that quantifies the amount of variation or dispersion in a set of data values relative to their mean. On the SAT, you aren't usually required to calculate the exact value of standard deviation using complex formulas, but you must understand how the spread of data affects this value. Mastering Hard SAT Standard Deviation Practice Questions is essential for students aiming for a top-tier math score, as these questions often appear in the "Problem Solving and Data Analysis" section.
Concept Explanation
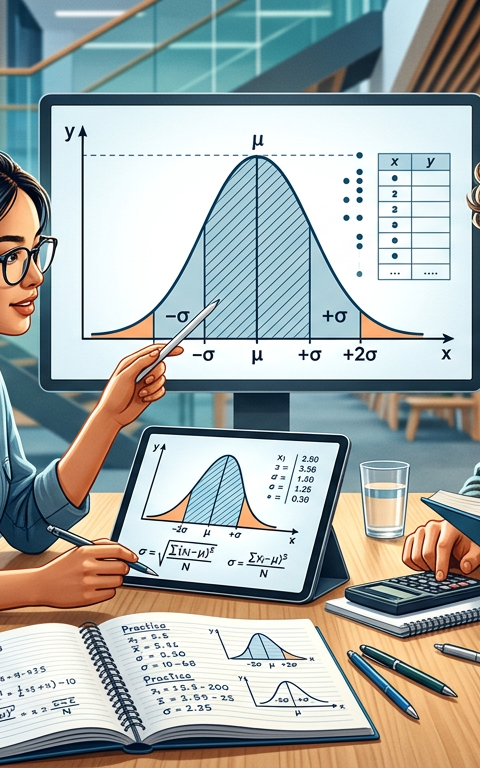
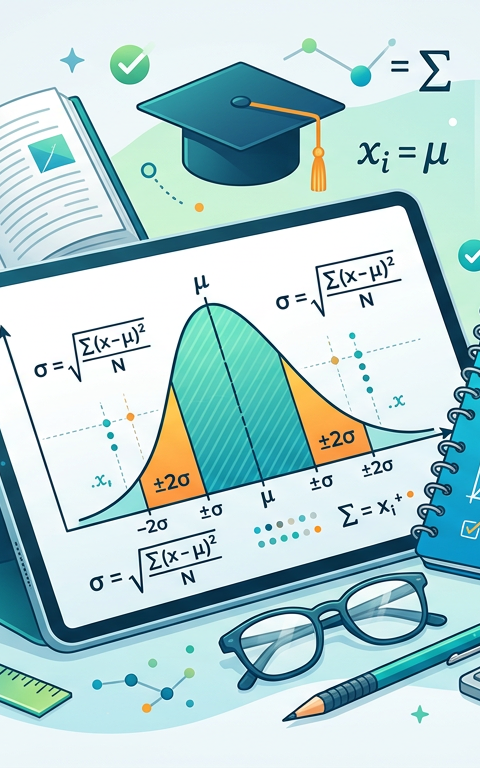
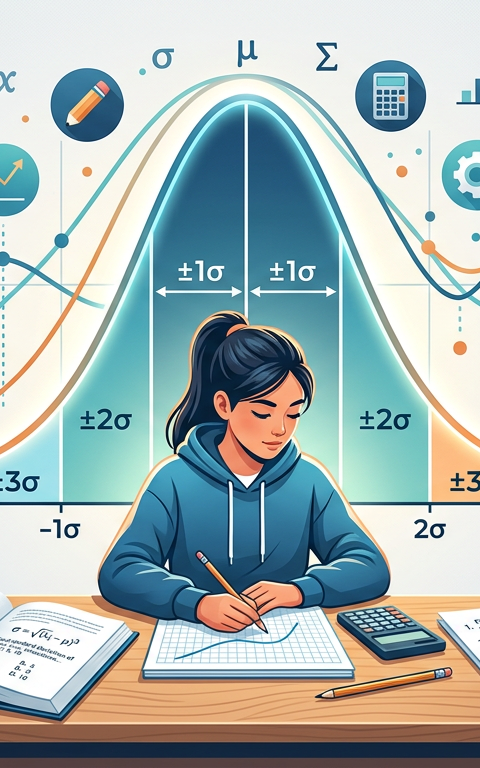
Standard deviation measures how far the data points in a set are spread out from the average (mean). A low standard deviation indicates that the data points tend to be very close to the mean, while a high standard deviation indicates that the data points are spread out over a wider range of values. On the SAT, you should focus on the "spread" of the data: the more "bunched up" the numbers are around the center, the smaller the standard deviation; the more "stretched out" the numbers are toward the extremes, the larger the standard deviation.
To visualize this, consider two datasets. Set A: {10, 10, 11, 11, 12, 12} and Set B: {2, 6, 11, 11, 16, 20}. Both sets have a mean of 11. However, Set A is very tightly clustered around 11, meaning it has a low standard deviation. Set B has values far away from 11, resulting in a much higher standard deviation. Key properties to remember for the SAT include:
- Adding or subtracting a constant to every value in a dataset changes the mean but does not change the standard deviation.
- Multiplying every value in a dataset by a constant does change the standard deviation by that same factor.
- Removing outliers (values far from the mean) decreases the standard deviation.
- Adding values exactly at the mean typically decreases the standard deviation because it increases the density of points at the center.
For more advanced data analysis techniques, you might also want to review hard SAT word problems which often integrate statistical concepts. Understanding the mathematical definition of standard deviation can provide a deeper conceptual foundation, even if the SAT focuses on qualitative comparisons.
Solved Examples
Example 1: Dataset X consists of the integers {5, 5, 5, 5, 5}. Dataset Y consists of the integers {4, 5, 5, 5, 6}. Which dataset has a larger standard deviation?
- Identify the mean of both sets. For Set X, the mean is . For Set Y, the mean is .
- Look at the spread. In Set X, every value is exactly at the mean. There is zero variation.
- In Set Y, two values (4 and 6) deviate from the mean.
- Since Set Y has more variation, Dataset Y has a larger standard deviation.
Example 2: A set of 100 test scores has a mean of 80 and a standard deviation of 5. If 2 points are added to every student's score, what happens to the mean and the standard deviation?
- Adding a constant to every data point shifts the entire distribution.
- The new mean will be .
- Since the relative distance between the points remains identical (the spread doesn't change), the standard deviation remains 5.
Example 3: Two frequency histograms show the distribution of heights in two different basketball teams. Team A's heights are concentrated between 72 and 76 inches. Team B's heights are evenly distributed between 68 and 80 inches. Which team has the smaller standard deviation?
- Analyze the concentration of data. Team A has a narrow range (4 inches) where all data points reside.
- Team B has a wider range (12 inches) with data points further from the center.
- The set with data points closer to the mean has the smaller standard deviation. Therefore, Team A has the smaller standard deviation.
Practice Questions
1. Set A contains the values {10, 20, 30, 40, 50}. Set B contains the values {110, 120, 130, 140, 150}. Which of the following statements is true regarding the standard deviations of the two sets?
2. A data scientist is measuring the weights of 500 lab mice. The standard deviation is currently 4 grams. If the scientist removes five mice whose weights are exactly equal to the mean weight of the group, what will happen to the standard deviation of the remaining 495 mice?
3. Two probability distributions, P and Q, are shown on a number line. Distribution P is a bell curve centered at 50 with a base width of 10. Distribution Q is a bell curve centered at 100 with a base width of 20. Which distribution has the larger standard deviation?
4. Dataset L: {2, 4, 6, 8, 10}. Dataset M: {4, 8, 12, 16, 20}. If is the standard deviation of Dataset L and is the standard deviation of Dataset M, what is the relationship between and ?
5. A teacher grades a difficult exam and finds the standard deviation of the scores is 12. If she decides to multiply every score by 1.5 to scale the grades, what will be the new standard deviation?
6. Consider two lists of numbers. List 1: {1, 2, 3, 4, 5, 6, 7}. List 2: {1, 1, 1, 4, 7, 7, 7}. Both lists have a mean of 4. Which list has the larger standard deviation?
7. A set of data consists of 10 integers. If an 11th integer is added to the set that is much further from the mean than any other value, how will the standard deviation change?
8. A company tracks the number of hours employees work per week. In Department X, the hours are {38, 39, 40, 41, 42}. In Department Y, the hours are {35, 35, 40, 45, 45}. Which department has a higher standard deviation?
9. A dataset has a standard deviation of 0. What can be concluded about the values in this dataset?
10. If you are comparing two dot plots, and Plot A is "skewed left" while Plot B is "symmetric and bell-shaped" with the same range, which one generally has a higher standard deviation? (Assume the bulk of Plot A's data is far from its mean).
Answers & Explanations
- Answer: The standard deviations are equal.
Explanation: Set B is simply Set A with 100 added to each value. Adding a constant to every value in a dataset does not change the spread of the data, so the standard deviation remains the same. This is a common trick in hard SAT standard deviation practice questions. - Answer: The standard deviation will increase.
Explanation: Standard deviation measures the average distance from the mean. If you remove values that are exactly at the mean, you are removing the values that have a distance of zero from the center. This makes the remaining values, on average, further from the center, thus increasing the standard deviation. - Answer: Distribution Q.
Explanation: Standard deviation is a measure of width/spread. Since Distribution Q has a base width of 20 compared to Distribution P's width of 10, the data in Q is more spread out from its center. - Answer: .
Explanation: Dataset M is created by multiplying every element of Dataset L by 2. When you multiply every value in a set by a constant , the standard deviation is also multiplied by . - Answer: 18.
Explanation: Multiplying every score by 1.5 scales the spread. New standard deviation = . - Answer: List 2.
Explanation: In List 1, the values are evenly spaced and relatively close to the mean (4). In List 2, most values (1s and 7s) are at the extreme ends of the set, far from the mean. More data at the extremes equals a higher standard deviation. - Answer: The standard deviation will increase.
Explanation: Adding an outlier (a value far from the mean) increases the total variation in the dataset, pulling the "average distance from the mean" upward. - Answer: Department Y.
Explanation: Department X's values are all within 2 units of the mean (40). Department Y's values include 35s and 45s, which are 5 units away from the mean. The larger gaps indicate a higher standard deviation. - Answer: All values in the dataset are identical.
Explanation: Standard deviation is only 0 when there is no variation at all. If every number is the same, the distance from the mean for every point is 0. - Answer: Plot A.
Explanation: Skewed distributions often have more data points located further away from the mean (in the "tail"), which typically results in a higher standard deviation than a tightly packed symmetric distribution of the same range.
1. If a dataset has a standard deviation of 10 and every value is increased by 5, what is the new standard deviation?
Frequently Asked Questions
Do I need to know the standard deviation formula for the SAT?
No, you do not need to memorize the formula for the SAT. The test focuses on your ability to compare the standard deviations of two datasets based on their spread or to understand how changes to the data (like adding a constant) affect the value.
What is the difference between range and standard deviation?
Range is simply the difference between the maximum and minimum values, while standard deviation considers how all data points are distributed around the mean. A dataset can have a large range but a small standard deviation if most points are clustered in the middle.
How does an outlier affect the standard deviation?
An outlier is a data point that is significantly different from the rest of the values. Adding an outlier increases the standard deviation because it increases the average distance of all points from the mean.
Can standard deviation be negative?
No, standard deviation can never be negative because it is calculated based on the square root of squared differences. The smallest possible value is zero, which occurs when all data points in a set are identical.
How is standard deviation related to the mean?
Standard deviation uses the mean as a reference point to calculate spread. While the mean tells you where the center of the data is, the standard deviation tells you how reliable that mean is as a representation of the whole dataset.
For further practice on related SAT math topics, check out our guides on hard SAT systems of equations and hard SAT quadratic equations. You can also explore more resources at Khan Academy's SAT Prep and College Board.
Enjoyed this article?
Share it with others who might find it helpful.
Related Articles
Medium SAT Standard Deviation Practice Questions
Medium SAT Standard Deviation Practice Questions
Apr 27, 2026
Easy SAT Standard Deviation Practice Questions
Easy SAT Standard Deviation Practice Questions
Apr 27, 2026
SAT Standard Deviation: How to Compare Data Spread Without Math
SAT Standard Deviation Practice Questions with Answers
Apr 27, 2026

Hard SAT Probability Practice Questions
Hard SAT Probability Practice Questions
Apr 27, 2026

Solving Weighted Averages and Median Shifts on the Digital SAT
Hard SAT Mean Median Mode Practice Questions
Apr 27, 2026

SAT Stats: Solving for Margin of Error and Skewed Distributions
Hard SAT Statistics Practice Questions
Apr 27, 2026

Medium SAT Probability Practice Questions
Medium SAT Probability Practice Questions
Apr 27, 2026

Medium SAT Statistics Practice Questions
Medium SAT Statistics Practice Questions
Apr 27, 2026