Easy SAT Standard Deviation Practice Questions

Easy SAT Standard Deviation Practice Questions
Mastering Easy SAT Standard Deviation Practice Questions is a vital step toward achieving a high score on the Digital SAT Math section. While you rarely need to calculate standard deviation by hand, you must understand how data spread affects this statistical value. This guide provides clear explanations, worked examples, and practice problems to help you build confidence in interpreting data sets and their variability.
Concept Explanation
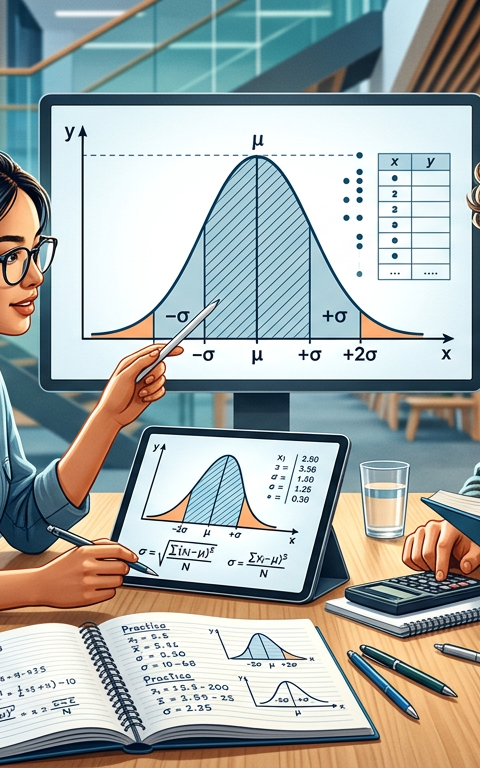
Standard deviation is a statistical measure that quantifies the amount of variation or dispersion in a set of data values relative to their mean. In the context of the SAT, you primarily need to understand that a low standard deviation indicates that the data points tend to be very close to the mean, while a high standard deviation indicates that the data points are spread out over a wider range of values.
To grasp this concept for the SAT, consider two different lists of test scores. If every student in a class scores exactly 85, the standard deviation is 0 because there is no variation. However, if scores range from 60 to 100, the standard deviation will be much higher. The College Board focuses on your ability to compare the spread of two different data sets—usually represented as lists, frequency tables, or dot plots—without requiring complex formulas. For more foundational math practice, you might also find Easy SAT Linear Equations Practice Questions helpful in rounding out your prep.
Key Principles of Standard Deviation on the SAT:
- Spread Matters: The further the data points are from the average (mean), the larger the standard deviation.
- Consistency: Data sets with clusters of values near the center have lower standard deviations.
- Outliers: Adding a value very far from the mean will increase the standard deviation.
- Shifting Data: Adding or subtracting the same constant from every value in a set changes the mean but does not change the standard deviation.
For a deeper dive into how statistics are used in academic research, you can explore resources from Wikipedia's Standard Deviation overview or Khan Academy's Statistics and Probability modules.
Solved Examples
Example 1: Data Set A consists of the numbers {10, 10, 10, 10, 10}. Data Set B consists of the numbers {8, 9, 10, 11, 12}. Which data set has a larger standard deviation?
- Identify the mean of both sets. For Set A, the mean is . For Set B, the mean is .
- Observe the spread. In Set A, every value is exactly the mean. There is zero variation.
- In Set B, the values 8, 9, 11, and 12 are spread away from the mean of 10.
- Conclusion: Data Set B has a larger standard deviation.
Example 2: A teacher has two classes. Class 1 has scores {70, 71, 72, 73, 74}. Class 2 has scores {60, 72, 72, 72, 84}. Without calculating, which class has the smaller standard deviation?
- Look at the range and proximity to the center. Class 1 scores are all within 2 points of the mean (72).
- Class 2 has scores like 60 and 84, which are 12 points away from the mean (72).
- Since Class 1's data points are more tightly clustered around the mean, it has the smaller standard deviation.
Example 3: If every value in a data set with a standard deviation of 5 is increased by 10, what is the new standard deviation?
- Understand the transformation. Adding 10 to every number shifts the entire distribution to the right on a number line.
- Recall the rule: Shifting data by a constant does not change the relative distance between points.
- Conclusion: The standard deviation remains 5.
Practice Questions
1. Data Set X: {5, 5, 5, 5, 5}
Data Set Y: {4, 5, 5, 5, 6}
Which set has the greater standard deviation?
2. A set of 10 integers has a mean of 50 and a standard deviation of 0. What must be true about the integers in the set?
3. Two dot plots represent the heights of players on two different basketball teams. Team A's heights are all between 72 and 76 inches. Team B's heights are all between 68 and 80 inches. Both teams have the same mean height. Which team has the larger standard deviation?
4. Data Set A: {10, 20, 30, 40, 50}
Data Set B: {110, 120, 130, 140, 150}
Compare the standard deviations of Set A and Set B.
5. A researcher measures the weights of 5 lab rats: {300g, 310g, 320g, 330g, 340g}. If a 6th rat weighing 320g is added to the study, will the standard deviation increase, decrease, or stay the same?
6. Two groups of students took a quiz. Group 1 scores: {8, 8, 9, 10, 10}. Group 2 scores: {6, 7, 9, 11, 12}. Which group has a higher standard deviation?
7. If the standard deviation of a set is , what is the standard deviation of the set ? (Hint: Think about how multiplying affects the distance between points).
8. Which of the following lists of numbers has the smallest standard deviation?
A) {1, 5, 9}
B) {4, 5, 6}
C) {3, 5, 7}
D) {2, 5, 8}
9. A company tracks the number of daily sales. In Week 1, the sales were {10, 11, 12, 11, 10}. In Week 2, the sales were {5, 10, 15, 10, 5}. Which week had more consistent sales (lower standard deviation)?
10. Consider the set {10, 12, 14, 16, 18}. If the number 14 is replaced with 30, how does the standard deviation change?
Answers & Explanations
- Set Y. Set X has no variation (standard deviation = 0). Set Y has values (4 and 6) that differ from the mean, so its standard deviation is greater than 0.
- All integers are equal to 50. A standard deviation of 0 means there is no spread; every value must be identical to the mean.
- Team B. Team B has a wider range (12 inches vs 4 inches). Since the data is more spread out from the mean, the standard deviation is larger. If you are struggling with comparisons like this, reviewing Easy SAT Ratio and Proportion Practice Questions can help with general data interpretation.
- They are equal. Set B is simply Set A with 100 added to every value. Shifting a data set does not change the spread/standard deviation.
- Decrease. The mean of the original set is 320g. Adding a value exactly at the mean (320g) reduces the average distance of all points from the mean, thereby decreasing the standard deviation.
- Group 2. Group 2 has a range of 6 (12 minus 6), while Group 1 has a range of 2 (10 minus 8). The values in Group 2 are further from the mean.
- . Multiplying every value by a constant multiplies the standard deviation by . Since the distances between points doubled, the standard deviation doubles.
- B) {4, 5, 6}. This set has the smallest range (2) and the values are closest to the mean of 5.
- Week 1. The values in Week 1 are very close to each other (range of 2). Week 2 has a much larger range (10), indicating higher variability.
- It increases. Replacing a value near the mean (14) with a value much further away (30) increases the total spread and the average distance from the mean. For more practice with how numbers interact in sets, check out Easy SAT Word Problems Practice Questions.
1. Which of the following changes to a data set will ALWAYS increase the standard deviation?
Frequently Asked Questions
Do I need to know the standard deviation formula for the SAT?
No, you do not need to memorize or use the complex mathematical formula for standard deviation on the SAT. The test focuses on your conceptual understanding of how spread out a data set is and how adding or changing values affects that spread.
What is the difference between range and standard deviation?
Range is simply the difference between the maximum and minimum values, while standard deviation considers how every single data point in the set relates to the mean. While they both measure spread, standard deviation provides a more nuanced view of the data's density.
Does adding a value equal to the mean always decrease standard deviation?
Yes, adding a data point that is exactly equal to the mean will decrease the standard deviation because it increases the number of points with zero deviation from the average. This effectively "pulls" the overall variability of the set downward.
Can standard deviation ever be a negative number?
Standard deviation can never be negative because it is calculated based on squared distances, which are always non-negative. The smallest possible value for standard deviation is zero, which occurs when all data points are identical.
How is standard deviation usually presented on the SAT?
On the SAT, standard deviation is typically presented through frequency tables, dot plots, or histograms where you are asked to compare the "spread" of two different groups. You may also see questions about how the standard deviation changes when a data set is transformed by addition or multiplication.
Enjoyed this article?
Share it with others who might find it helpful.
Related Articles

Hard SAT Standard Deviation Practice Questions
Hard SAT Standard Deviation Practice Questions
Apr 27, 2026
Medium SAT Standard Deviation Practice Questions
Medium SAT Standard Deviation Practice Questions
Apr 27, 2026

SAT Standard Deviation: How to Compare Data Spread Without Math
SAT Standard Deviation Practice Questions with Answers
Apr 27, 2026

Hard SAT Probability Practice Questions
Hard SAT Probability Practice Questions
Apr 27, 2026

Solving Weighted Averages and Median Shifts on the Digital SAT
Hard SAT Mean Median Mode Practice Questions
Apr 27, 2026

SAT Stats: Solving for Margin of Error and Skewed Distributions
Hard SAT Statistics Practice Questions
Apr 27, 2026

Medium SAT Probability Practice Questions
Medium SAT Probability Practice Questions
Apr 27, 2026

Medium SAT Statistics Practice Questions
Medium SAT Statistics Practice Questions
Apr 27, 2026